Galveston Bay

is Texas’ largest estuary – a coastal

body of water with a free connection with

the open sea – and it starts in your backyard.

Overall Health of the Bay

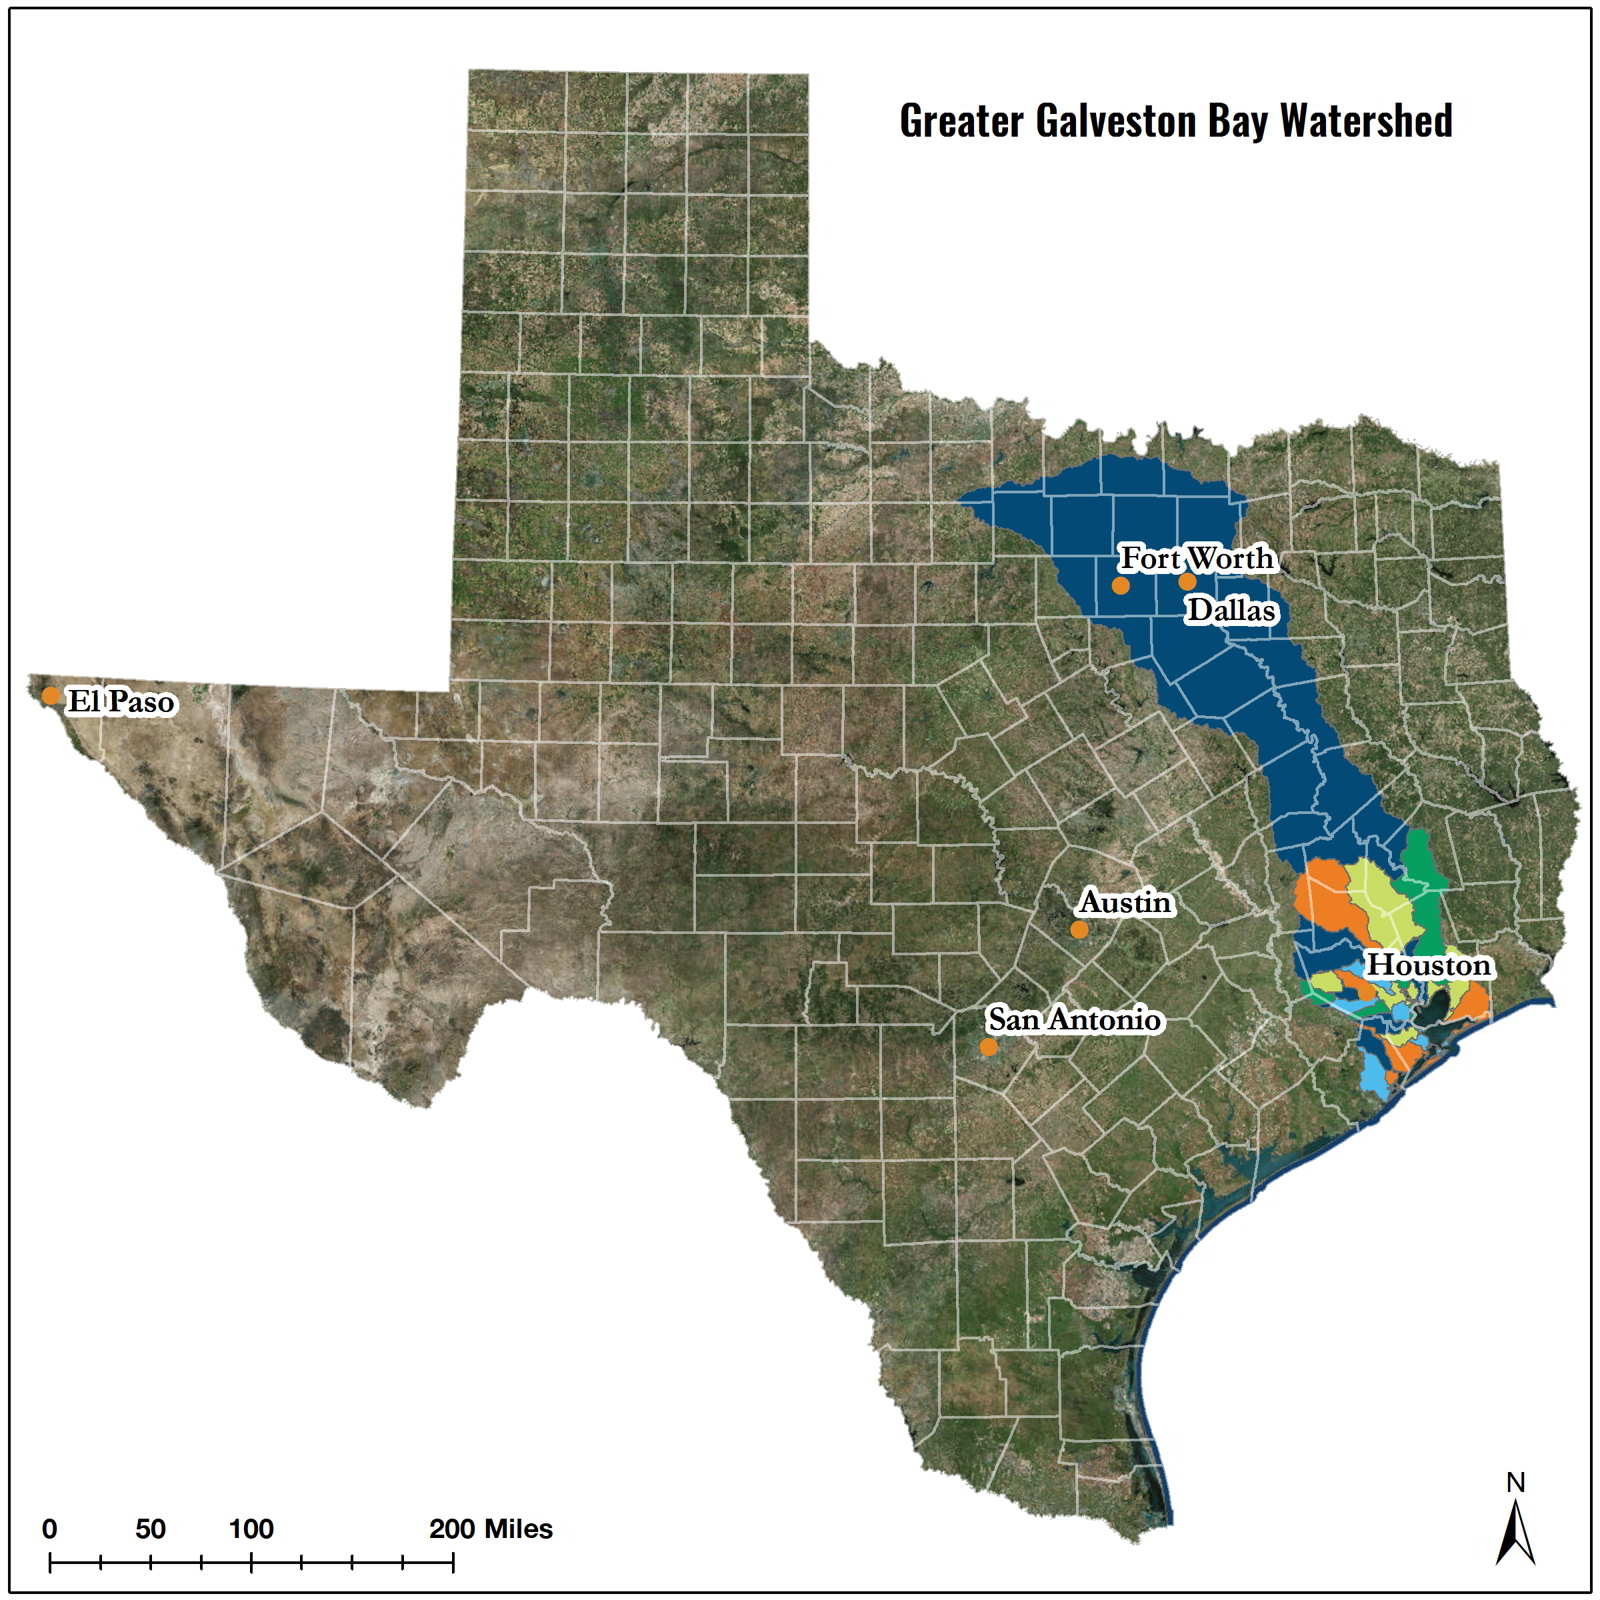
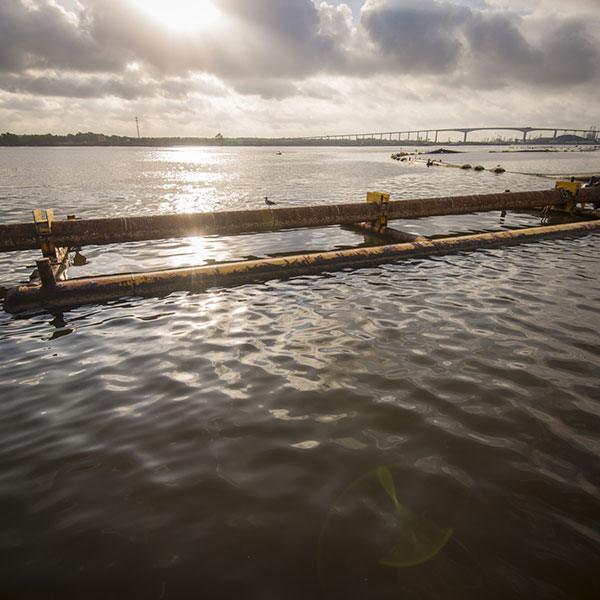
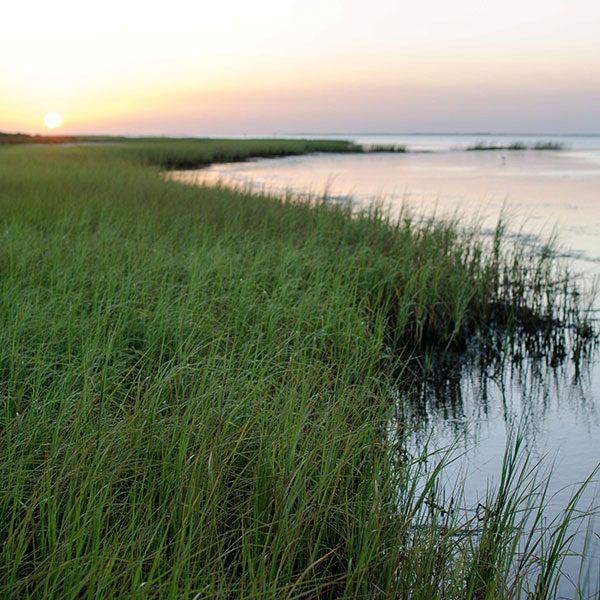
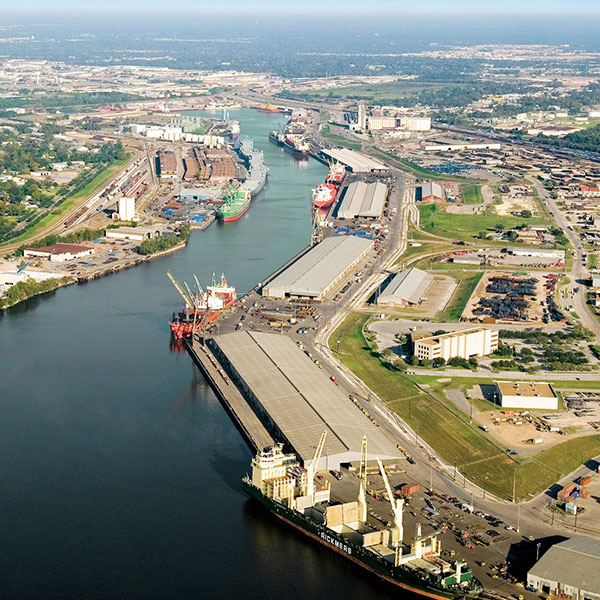
Galveston Bay is resilient, but faces an uncertain future. The Bay’s watershed is home to the fourth- and ninth-largest cities in the U.S., Houston and Dallas. It’s also home to three ports, and remains a hub for the manufacturing and refining of chemicals and petroleum products. But people, industry, and commerce often come with environmental challenges. Galveston Bay’s most significant problems are tied to pollution, declines in habitat acreage, and to the impacts of climate change, like sea level rise.

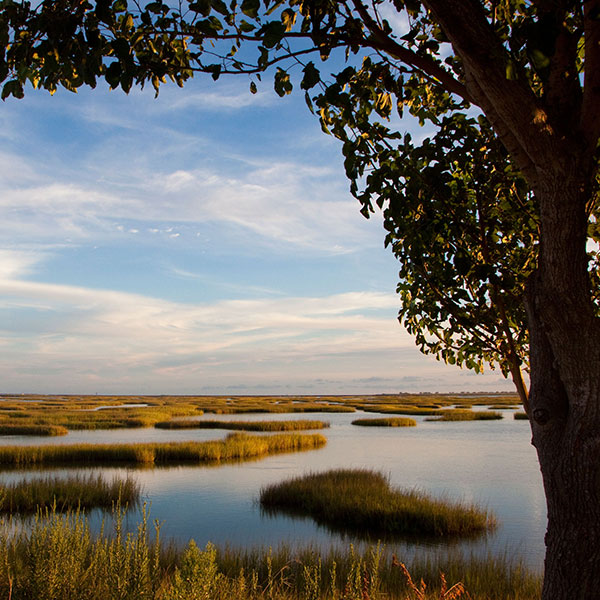
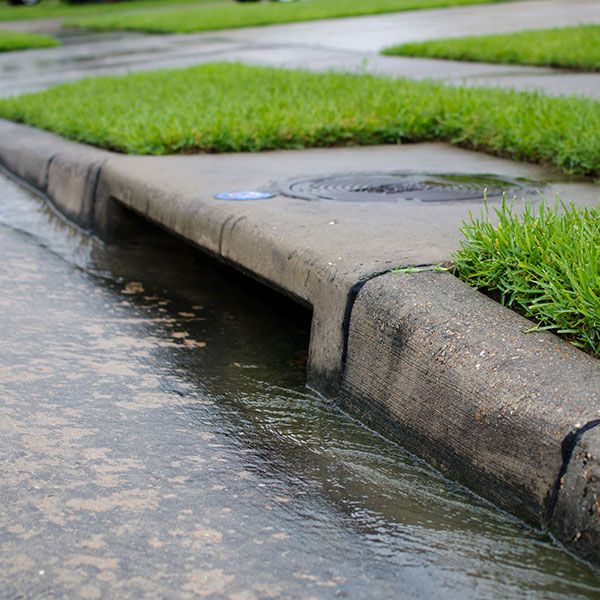
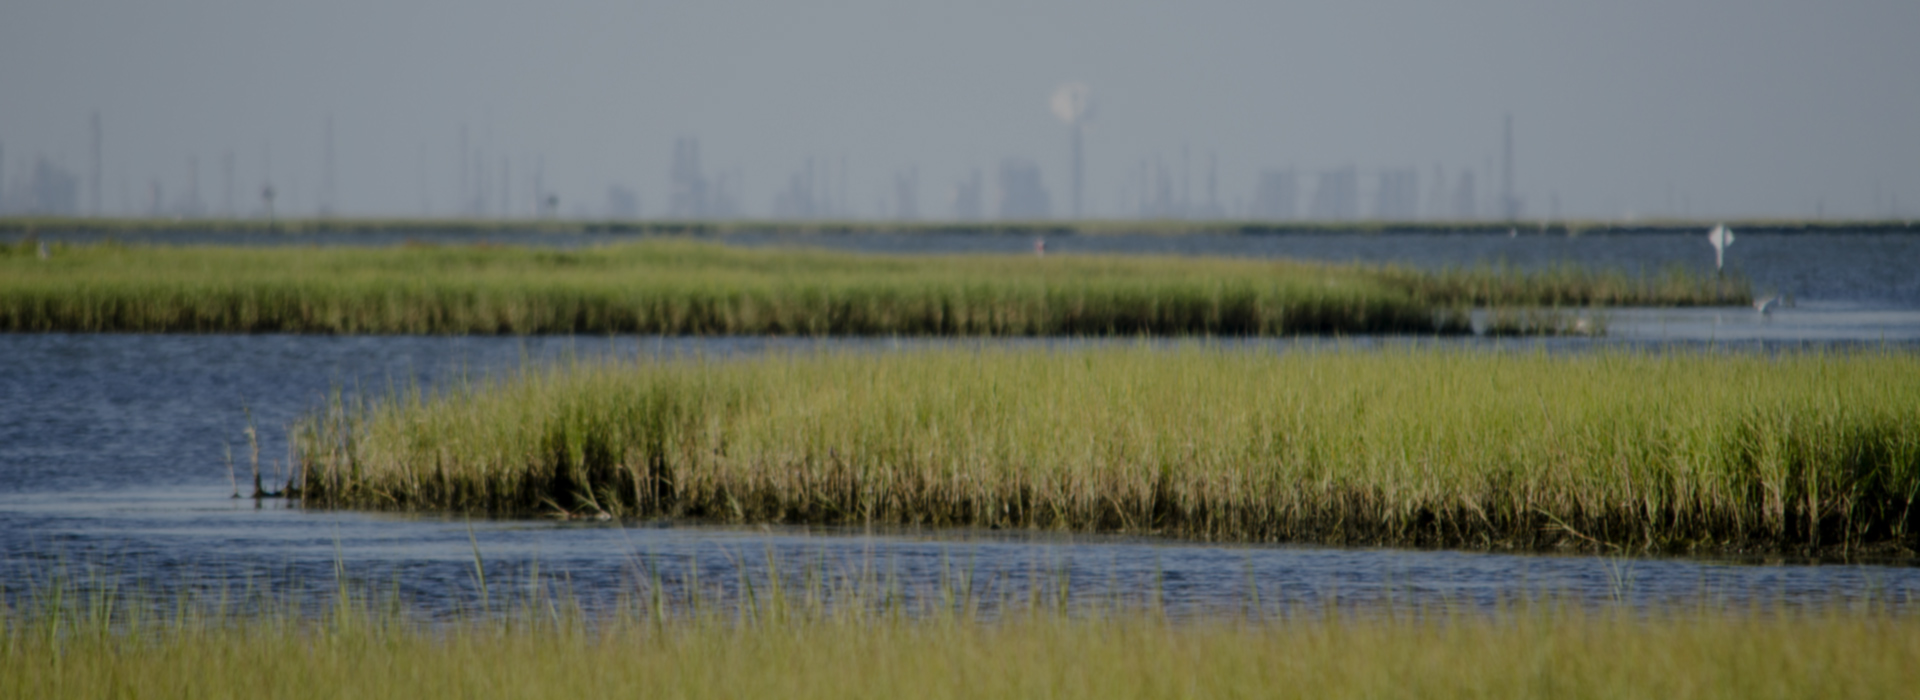
To keep Galveston Bay resilient, it’s important that we take action to protect each category and indicator grade. It is up to us, the communities around the bay, to continue to make changes in the way we live to lessen the negative impact on water quality, habitat like wetlands and seagrasses, and wildlife.

Estuaries are among the most productive ecosystems in the world.

About the Bay

Galveston Bay is Texas’ largest bay, covering about 600 square miles. The Galveston Bay watershed is about 24,000 square miles. It stretches northward from the Houston metropolitan area, up the Trinity River basin, and past the Dallas-Fort Worth area. Half the population of Texas currently lives in the Galveston Bay watershed.


As an estuary, Galveston Bay is among the most productive ecosystems in the world. The Bay and the habitats within its watershed provide many benefits to society, including
fisheries/seafood, water quality improvement, erosion, flood and storm protection, regulation of local climate, aesthetics and recreational opportunities such as swimming, boating, and bird watching.

Greater Galveston Bay Watershed

Click to learn more about About the Bay
null

Ensuring a healthy future for Galveston Bay is ensuring that future generations can enjoy a safe place to not only live, but also swim, boat and fish

About This Project

The Galveston Bay Report Card is a citizen-driven, scientific analysis of the health of Galveston Bay. Implemented by the Houston Advanced Research Center (HARC) and the Galveston Bay Foundation (GBF), the report card’s goal is to engage community members in meaningful discussion about Bay health topics. The report card is designed to inspire people to take actions that protect and preserve the Bay.


Through a series of surveys and interactive presentations, six topic categories were identified by the Galveston Bay Foundation as health topics of interest to the public in the fall of 2014: Water Quality, Pollution Events & Sources, Wildlife, Habitat, Human Health Risks and Coastal Change. Scientists from the Houston Advanced Research Center then analyzed data and trends for 18 indicators. What has emerged is a compelling story about Galveston Bay, its challenges, opportunities, and greatest needs.


Each indicator features easy-to-understand grades, similar to the grades you would find in a school report card. These indicators show specific ways you can help the Bay as well as data-driven infographics, additional resources, and downloadable full reports with expanded content. There is also specific data on each indicator.

How We Grade

The goal of the Federal Clean Water Act of 1972 is to make the nation’s waters swimmable and fishable. That goal was our guideline in measuring the indicators for this report card. In this project, the Bay’s health is perceived as a question of sustainability and resiliency: Do the indicator trends portray a Bay that will continue to provide recreation, food, clean water, and protection from storms?


Instead of trying to apply a universal grading methodology to such a variety of Bay indicators, some degree of best professional judgment was used to determine overall category grades and indicator grading scales. A detailed explanation outlines how grades were calculated and when grading relied heavily on best professional judgment based on available data. This is disclosed in the downloadable PDFs for each indicator. Letter grades correspond to a 4.0 grade point average scale, and are accompanied by descriptors ranging from”Excellent” to”Critical.”

What We Can do

A

Excellent

B

Good

C

Adequate for Now

D

Requires Action

F

Critical

I

Insufficient Data

null

Want more? Check the grades on other Indicators.

Overview
Water Quality
Pollution Events & Sources
Habitat
Wildlife
Human Health Risk
Coastal Change