Coastal Change Summary

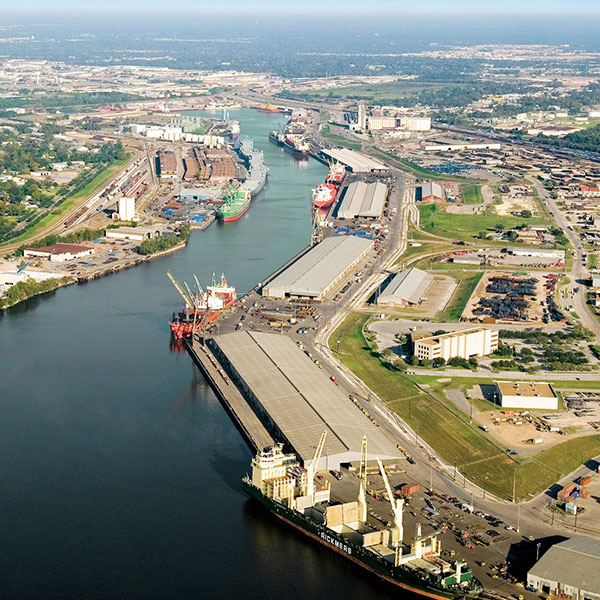
Coastal change is becoming a high priority as communities around the world face climate-related challenges. Nearly half of the U.S. population lives in coastal areas and the majority live in urban centers such as the Houston-Galveston metropolitan area. It is vital that we understand our vulnerabilities to a changing coast and adapt to enhance resilience in the Houston-Galveston region and along Texas’ coastline. Vulnerabilities as a coastal metropolis, often involve our reliance on and proximity to water.

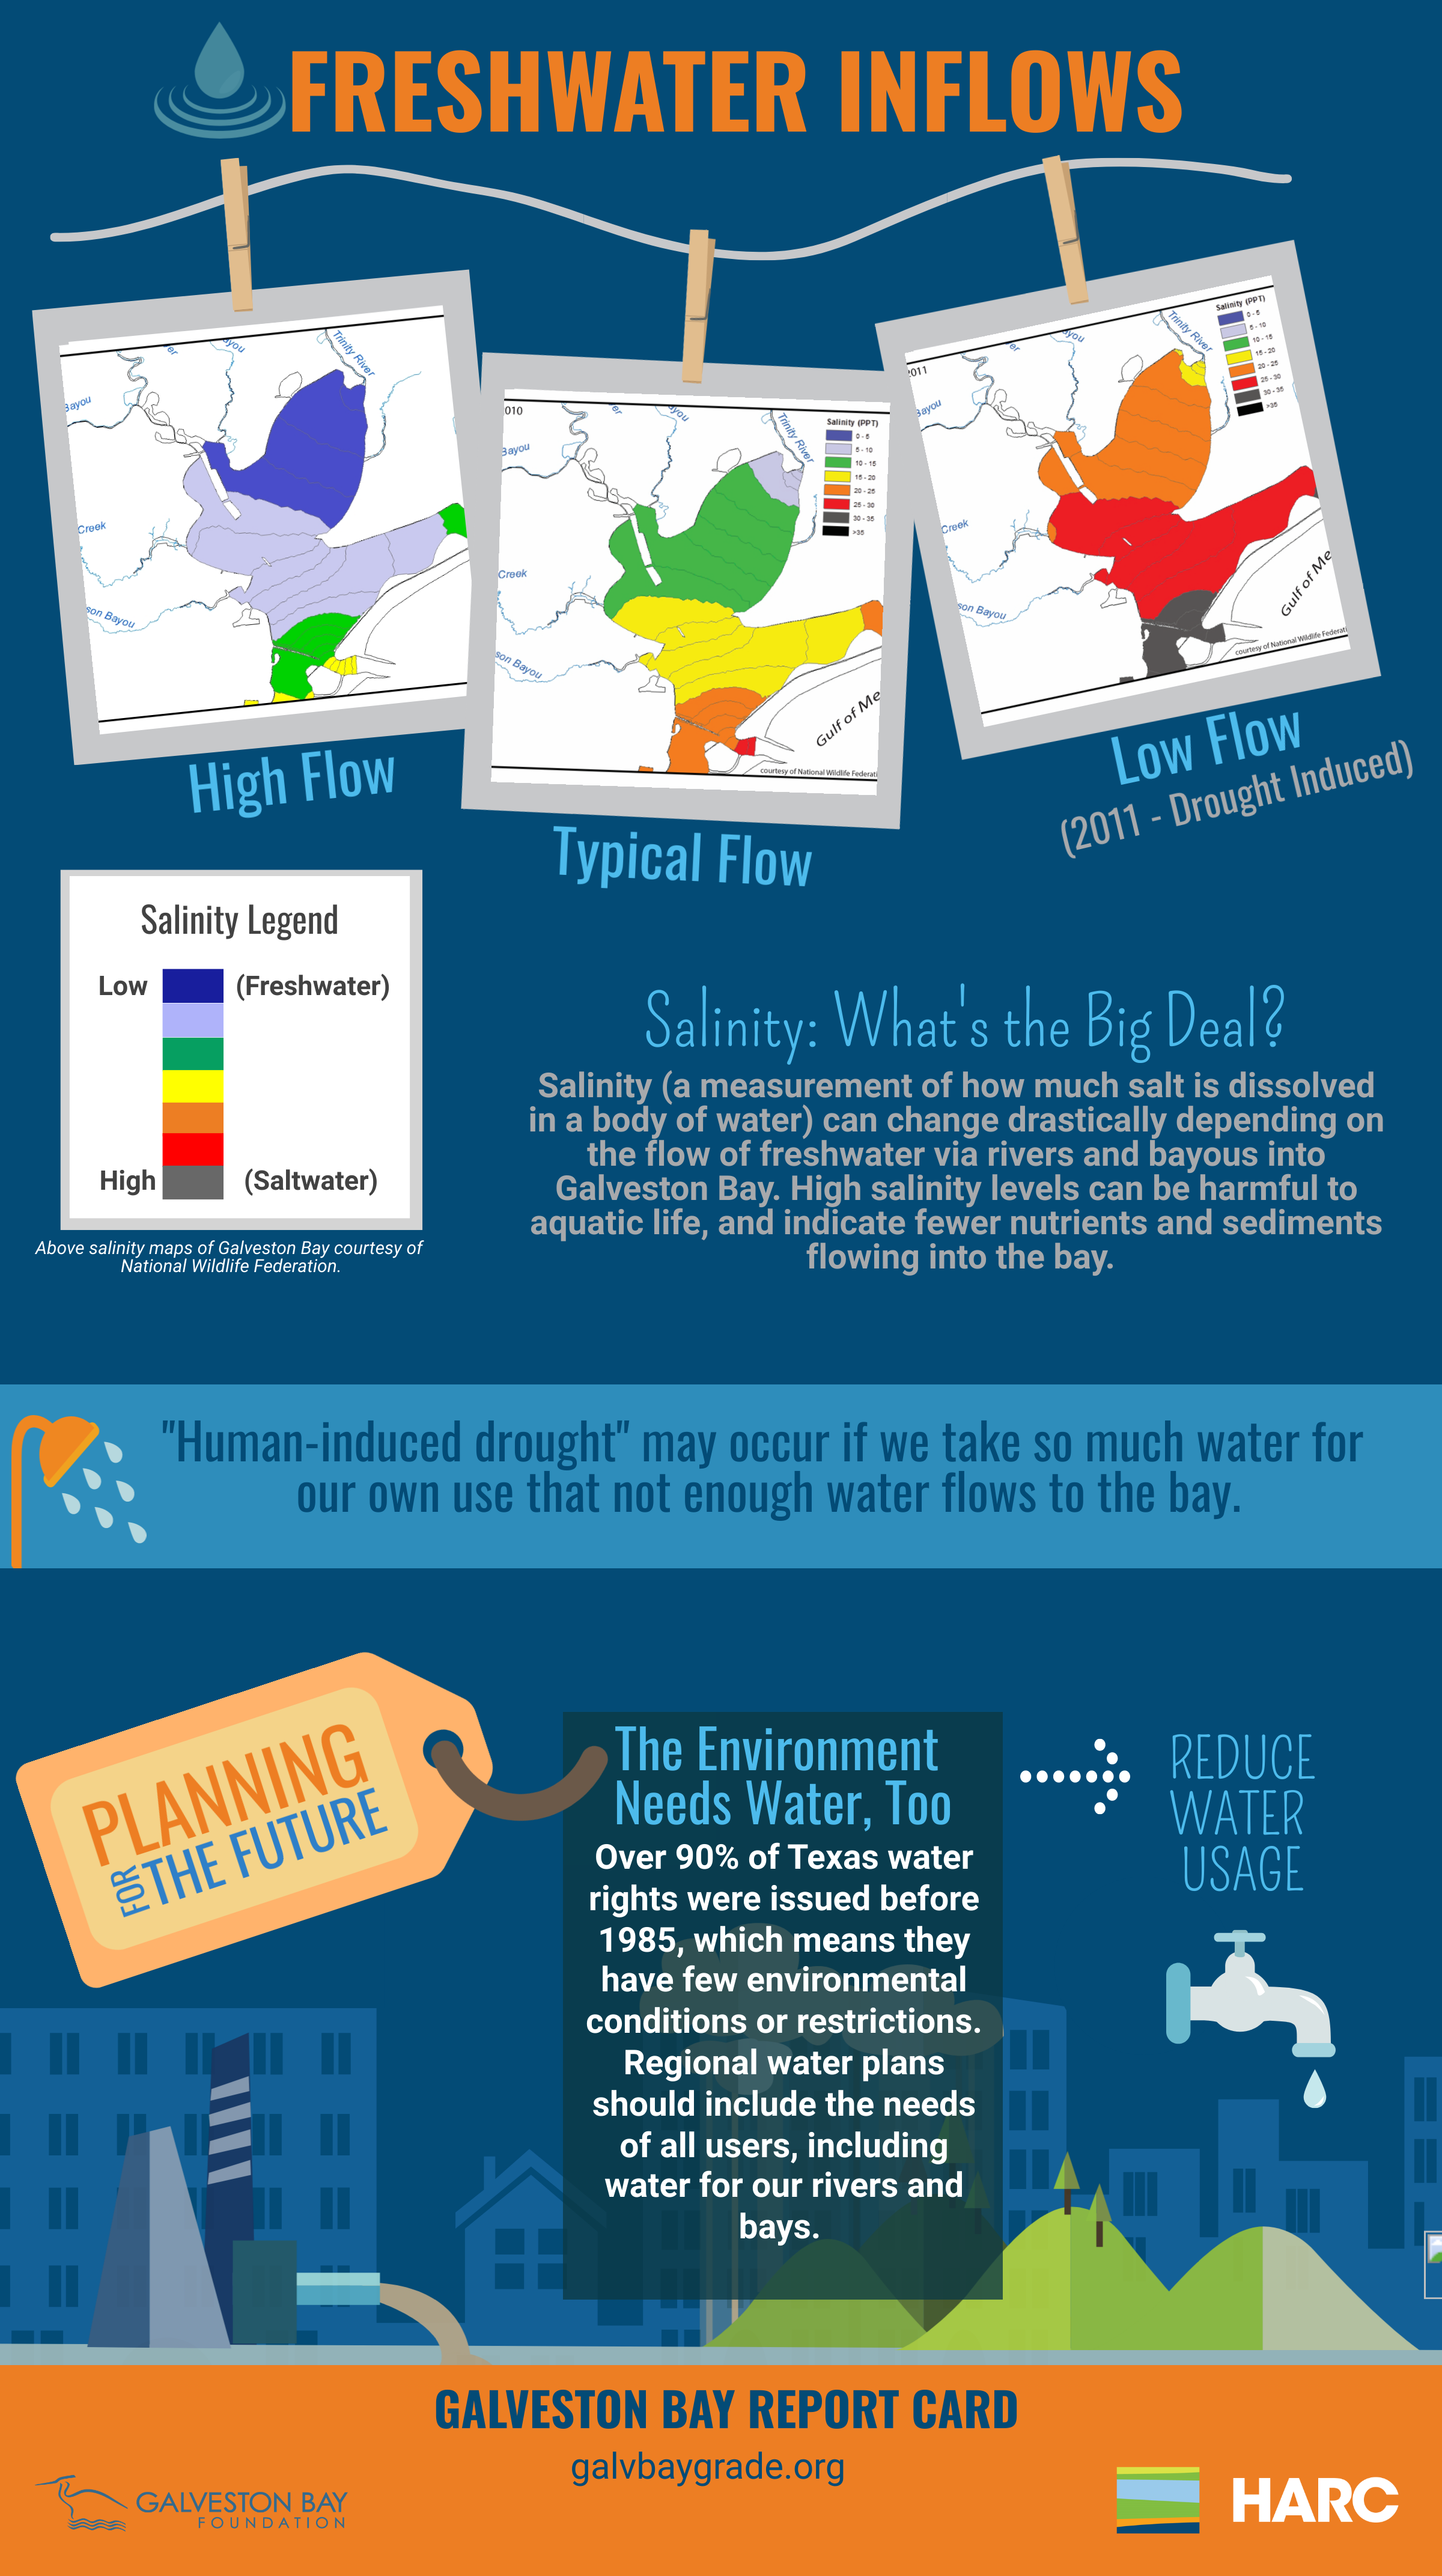
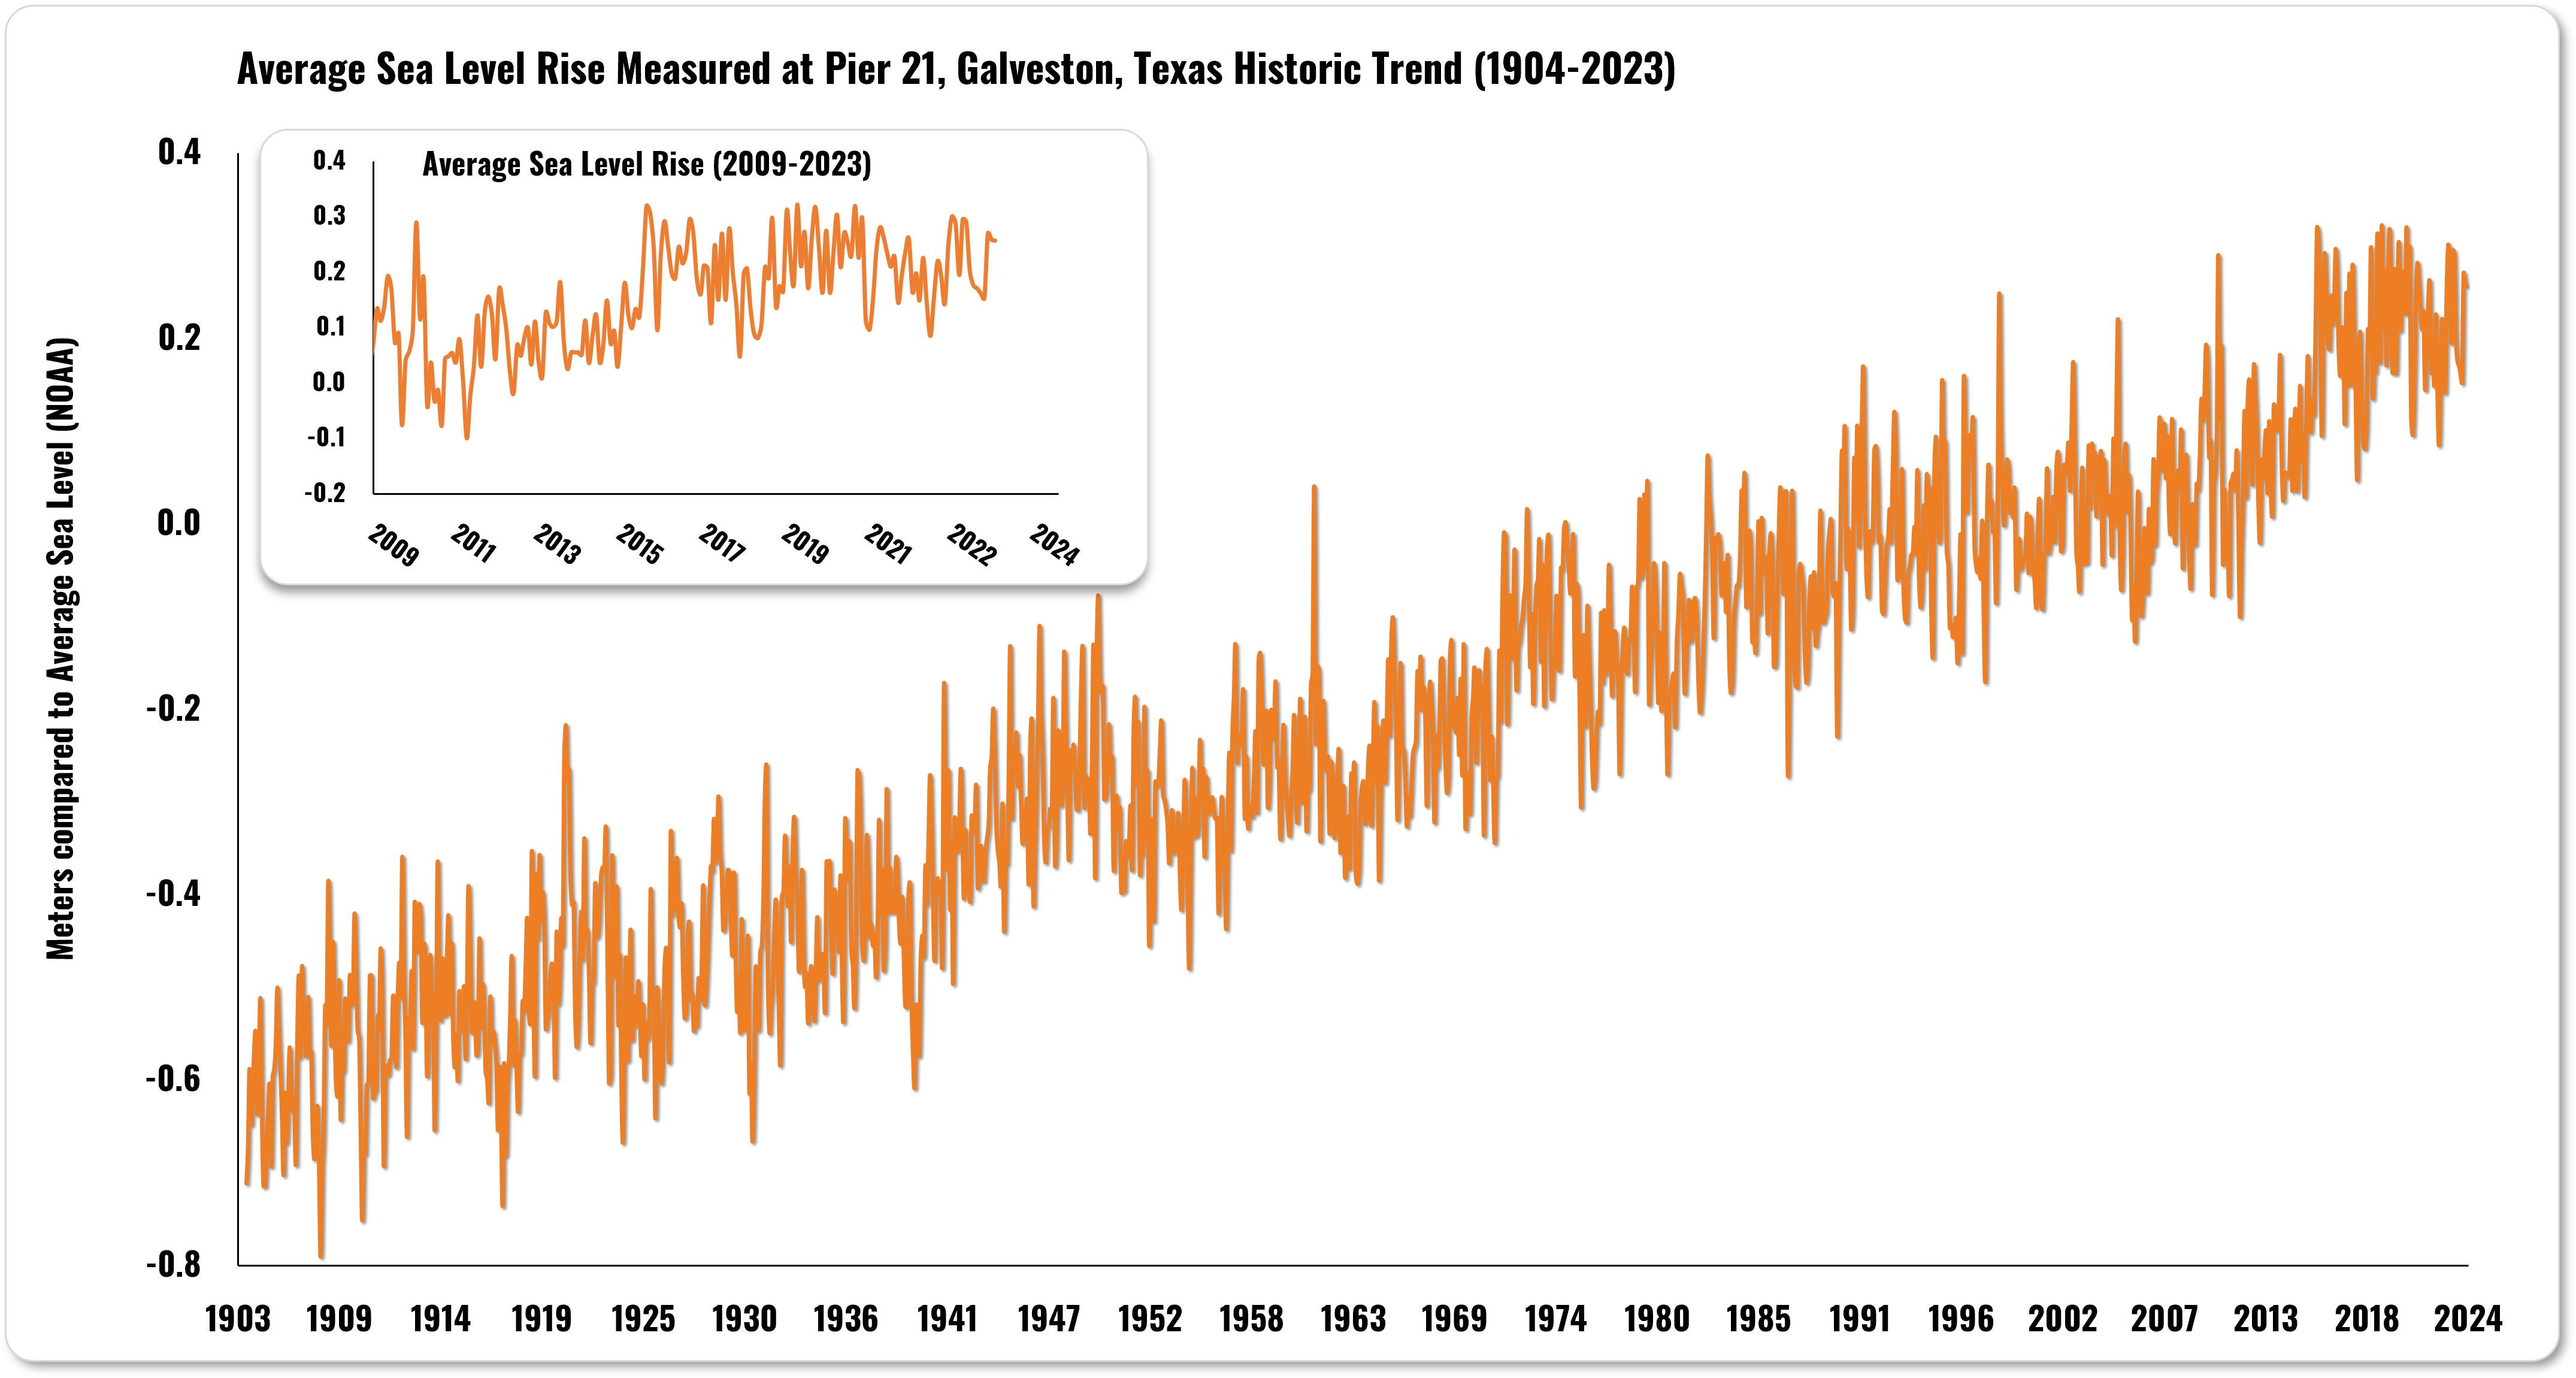
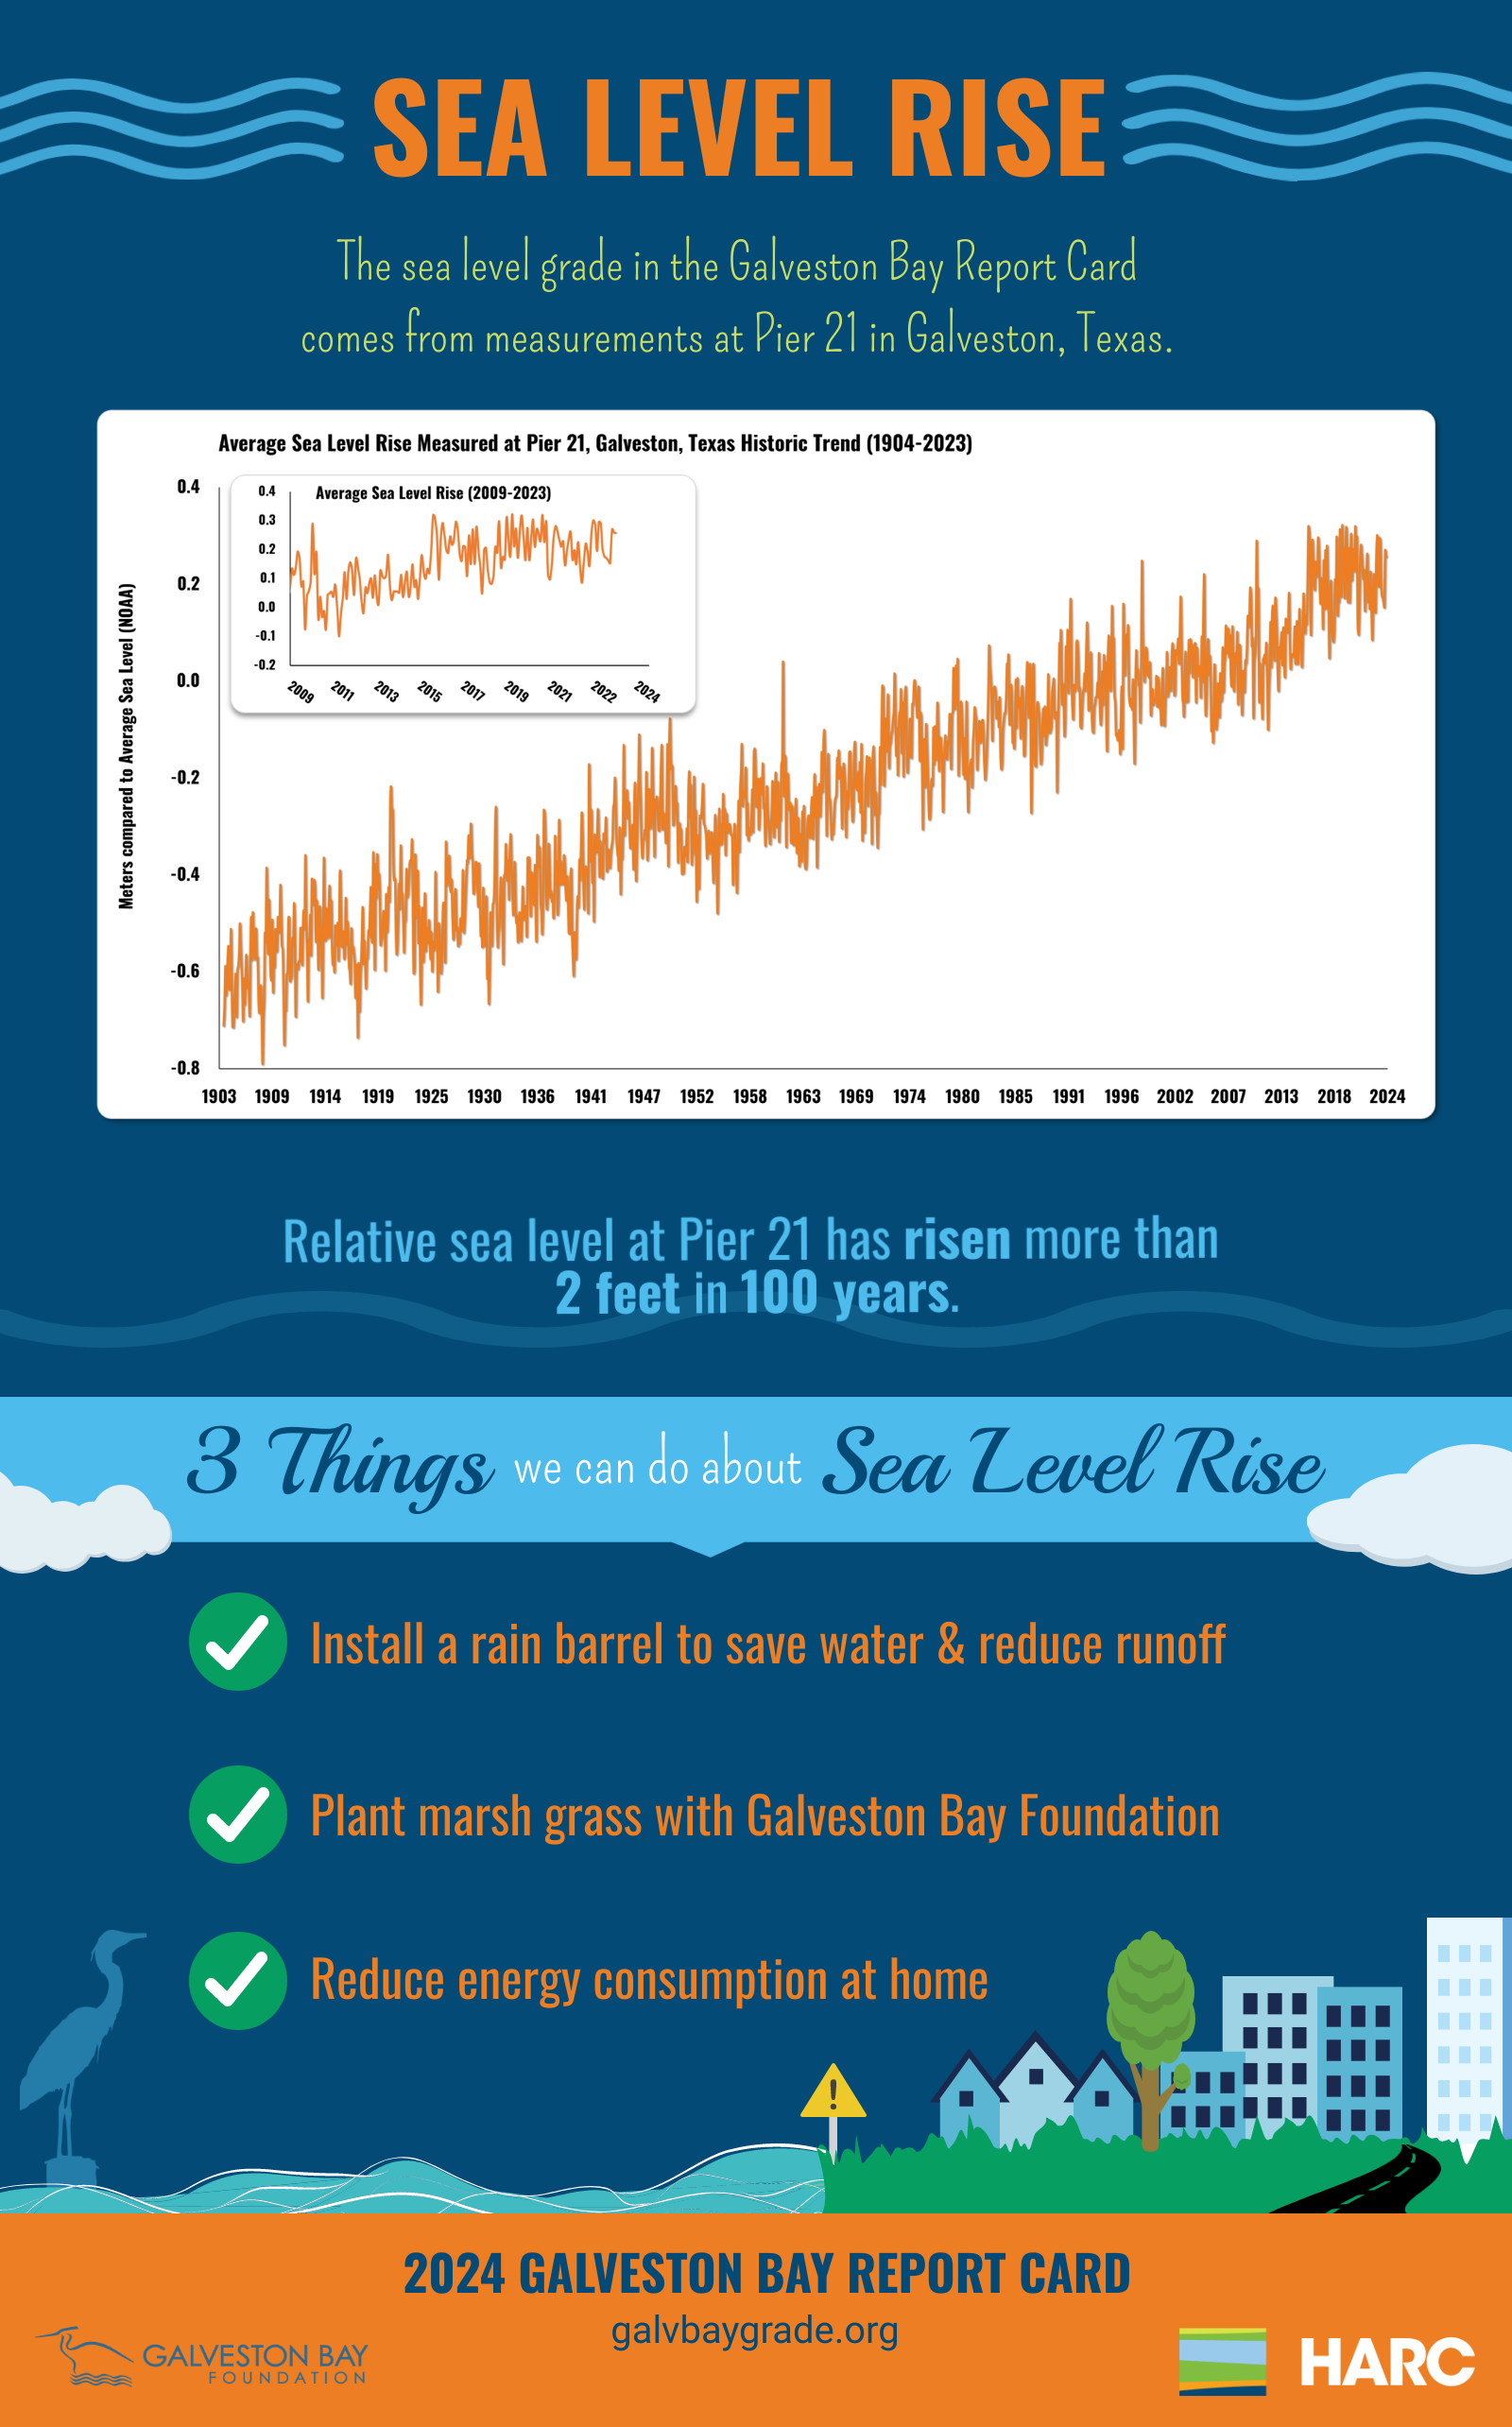
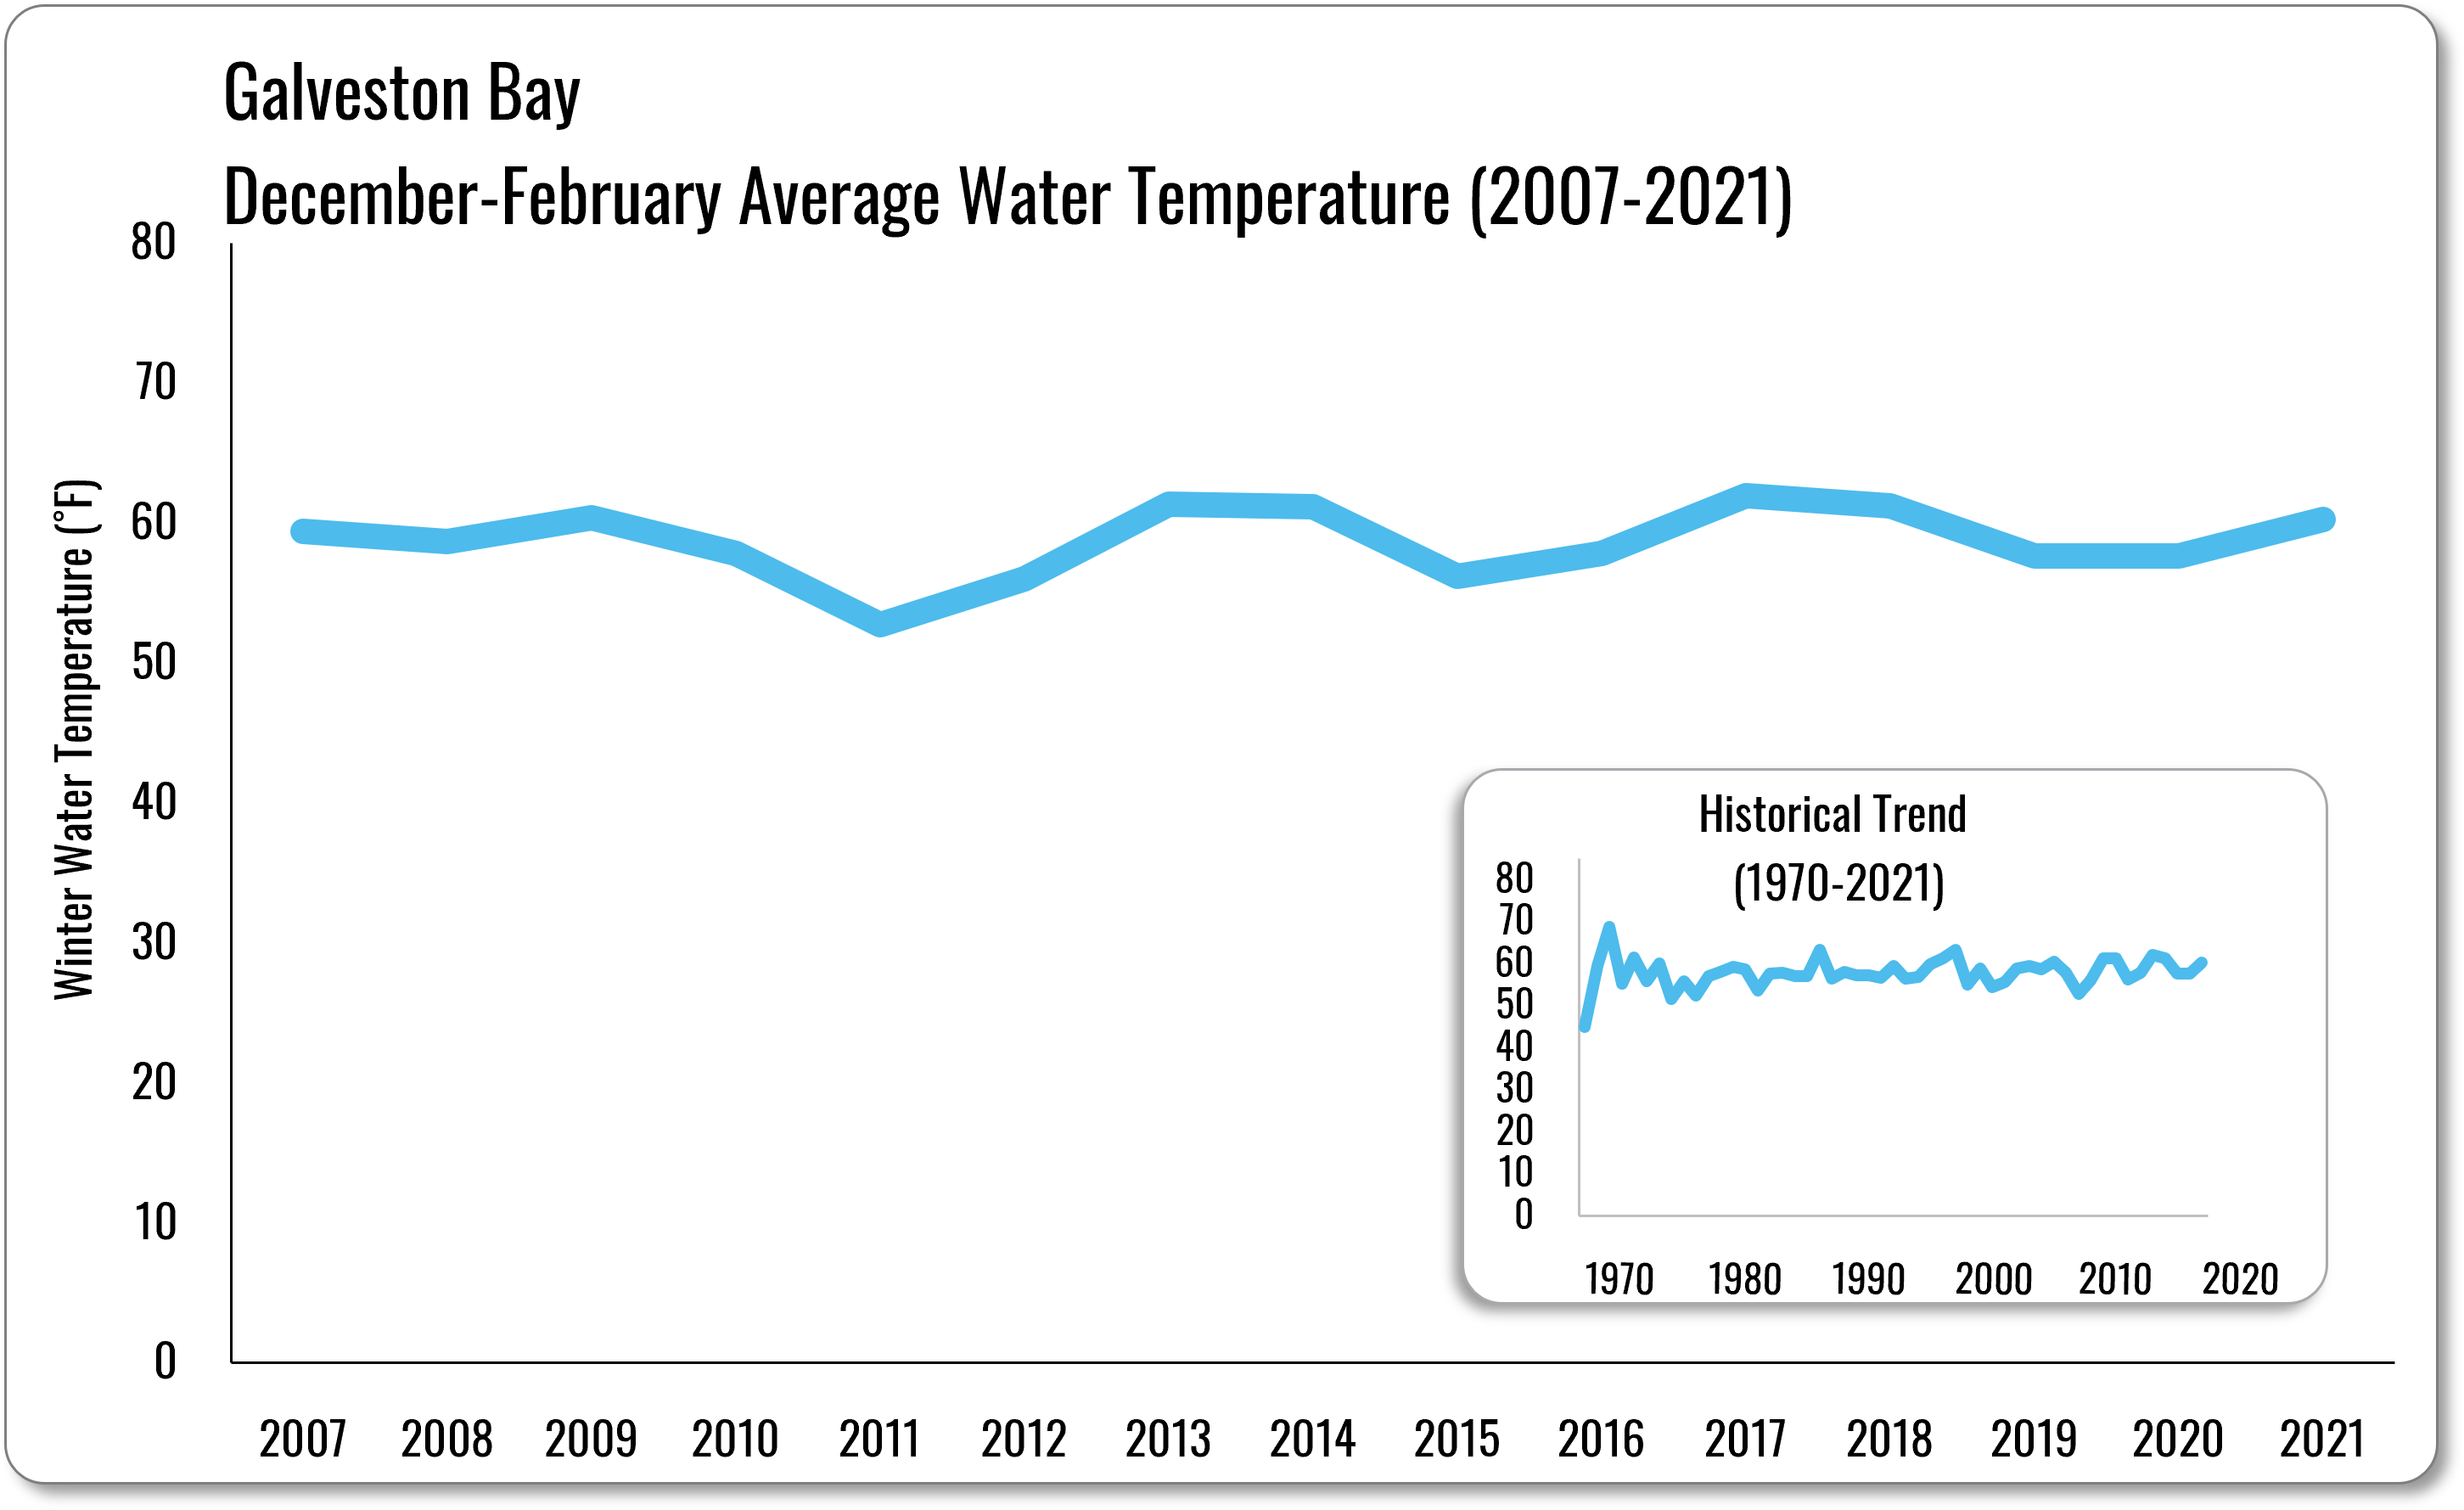
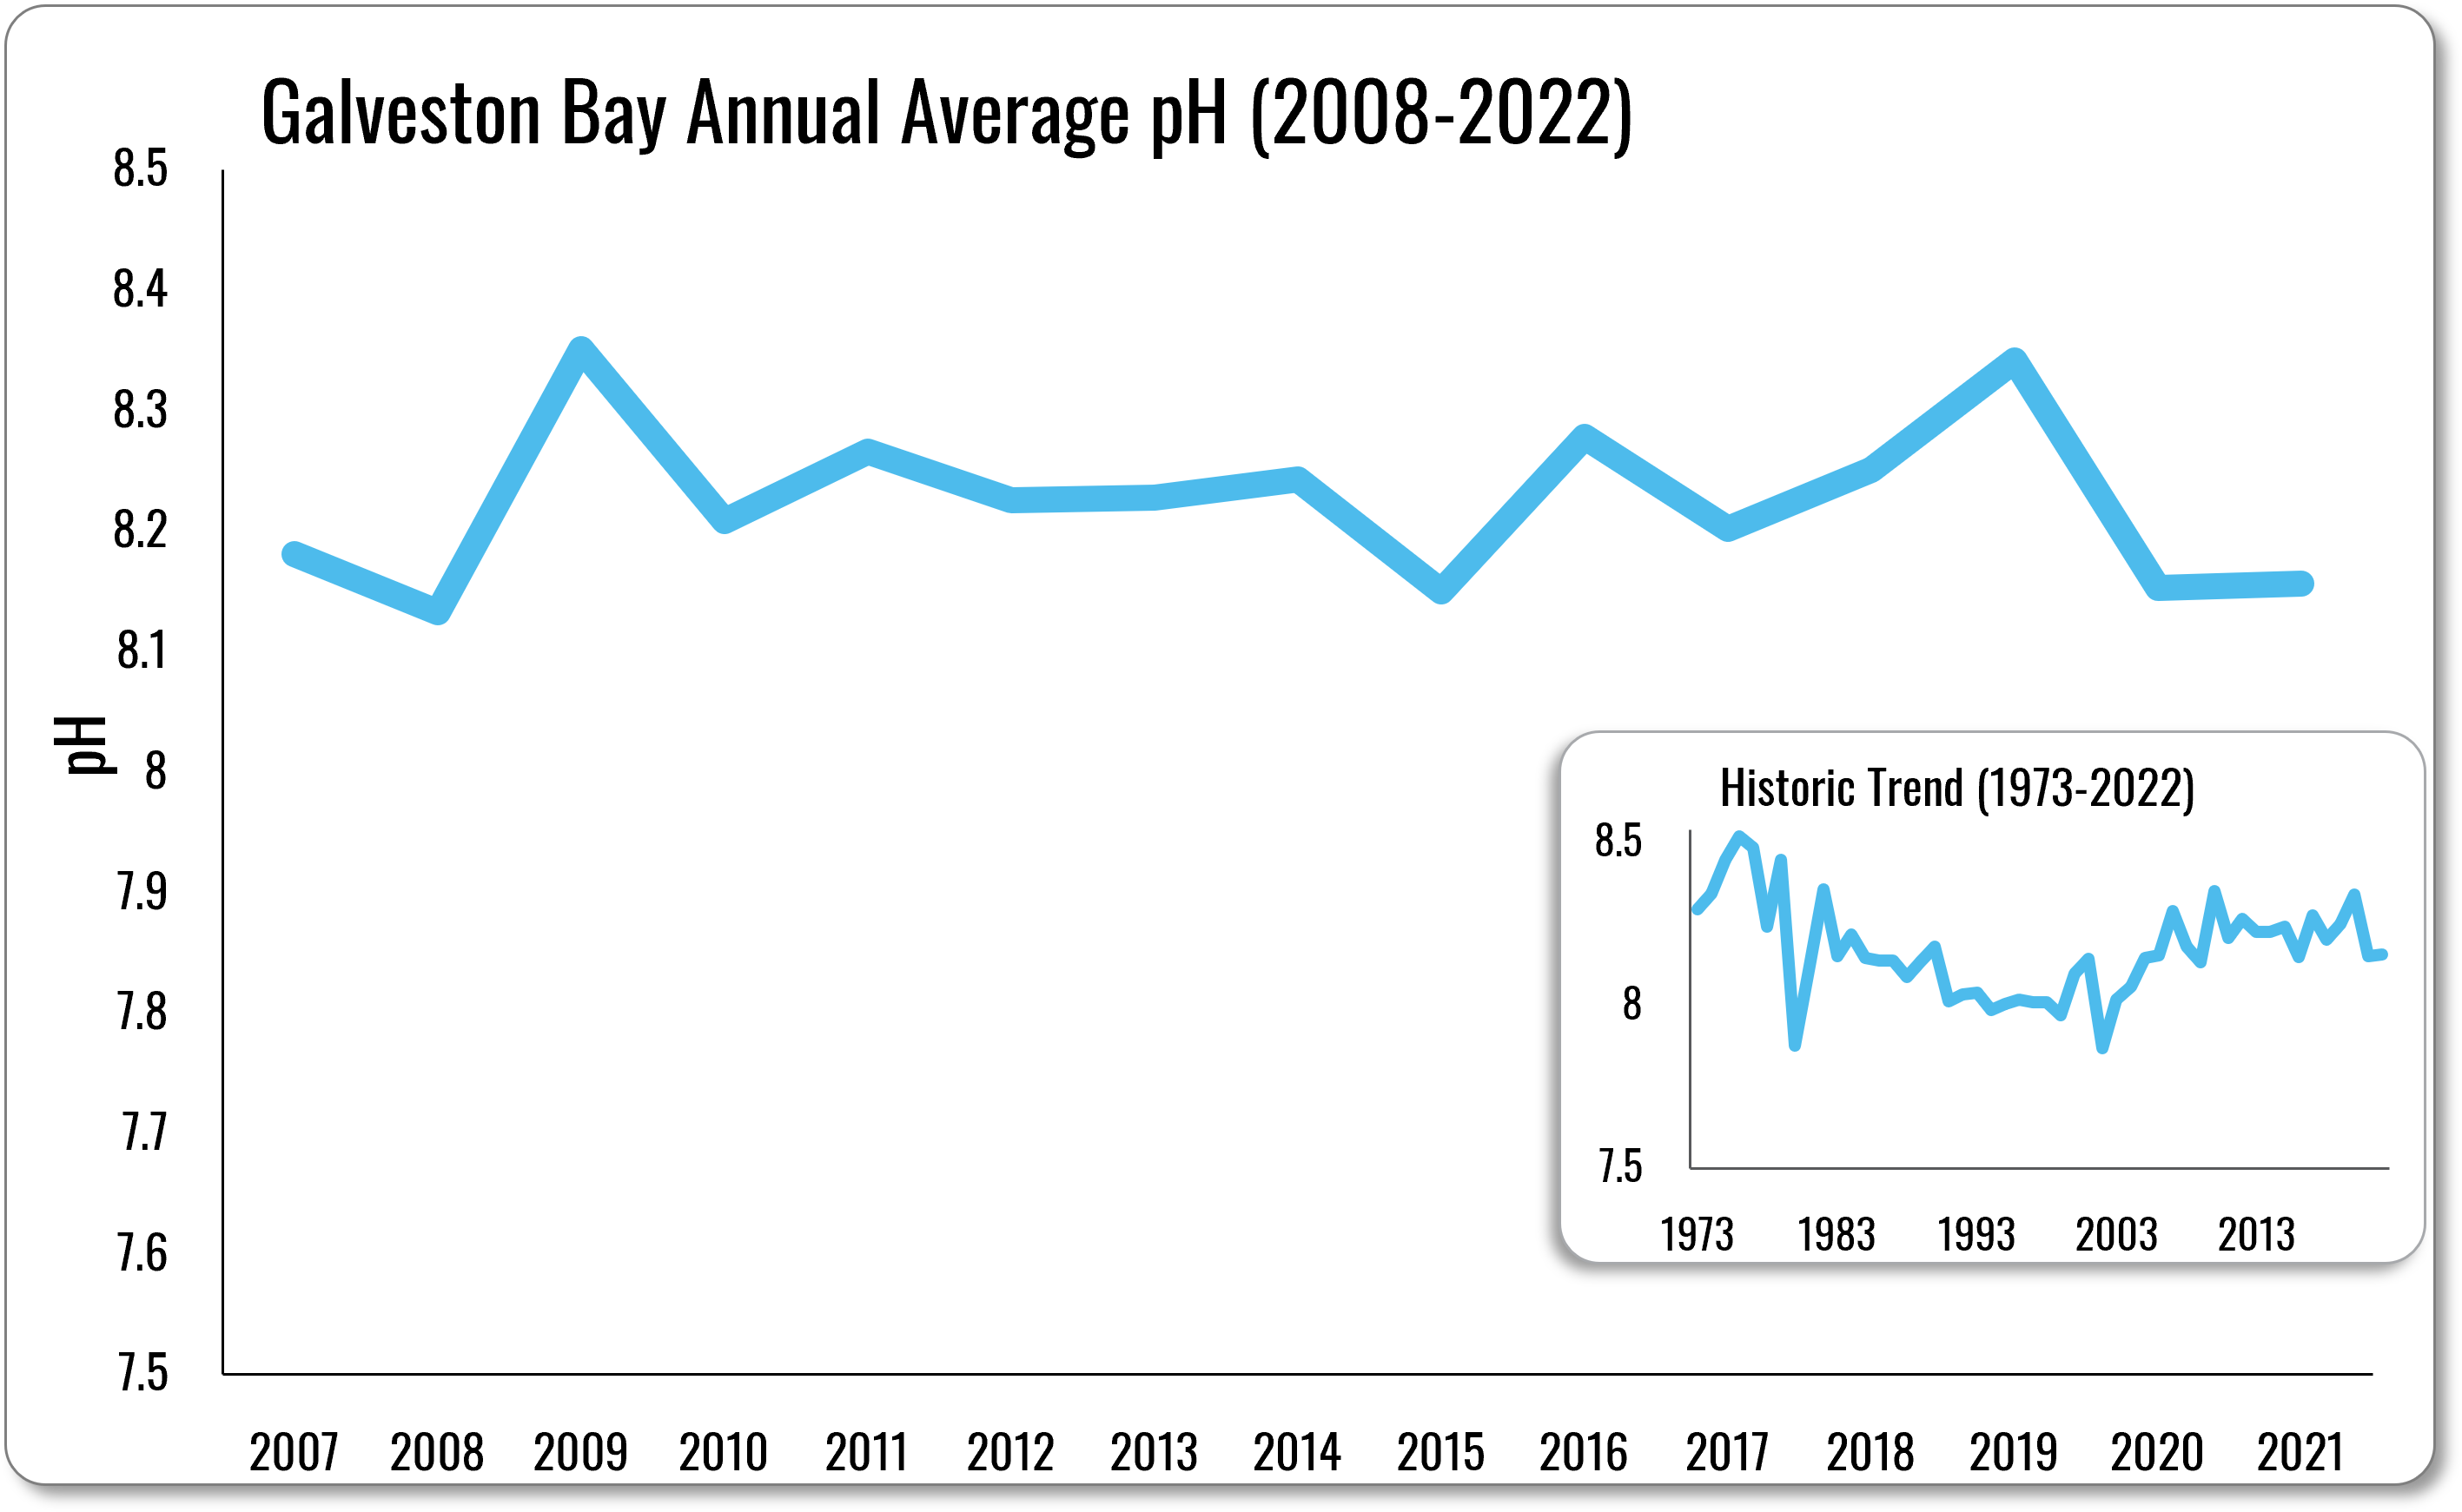
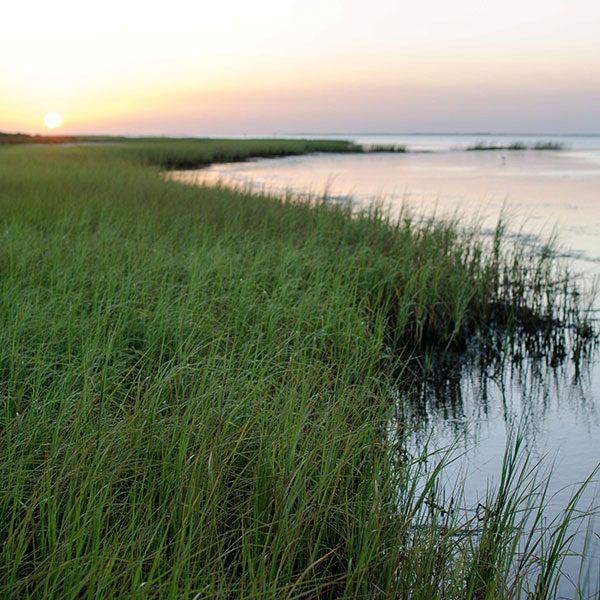
While pH levels of the Bay have levelled out, winter water temperatures have risen for the first time and the high rate of relative sea level rise and increases in freshwater demands are concerning. Winter water temperature is an important indicator for invasive species, and can indicate overall warming that can impact bacteria production and stress Galveston Bay organisms. As sea level rises and weather patterns change, alternating between extremes of drought and flood, extreme heat and cold, we will witness measurable changes in the physical environment of Galveston Bay.

C
Grade

What We Can do

  • Conserve water by landscaping with native plants, installing water-saving appliances, and using water only when necessary.
  • Reduce your carbon footprint by driving less, considering fuel efficiency when purchasing a vehicle, and conserving electricity.
  • Use less “stuff” by recycling and repurposing. Watch The Story of Stuff.


Freshwater Inflows

Bays and estuaries are bodies of water where freshwater and marine environments mix. The Bay’s ecosystem depends on freshwater flowing downstream from rivers, bayous, and creeks. The amount and timing of freshwater inflows are directly related to salinity, the availability of nutrients to fuel the food web, and the availability of sediment that supports Bay habitats.

On average, the Houston-Galveston region receives 40-50 inches of rainfall a year. However, the region experienced an extreme drought between 2010 and 2012, with extremely dry conditions in 2011. In 2015 and 2016, rainfall rates were again above average with major flood events in May and April of those years, respectively. 2017 rainfall rates set records due to Hurricane Harvey, and 2018 had even higher inflows.

In 2022, we released a new freshwater inflows grading system. It is clear that Galveston Bay wildlife is impacted by both low and high extreme flow events. Water use and climate variability can result in both extreme low flow and extreme high flow events in the same year. In order to capture that variability, and the threat to freshwater inflows in the region, the grades are now calculated for both low and high flow events, and grouped in three-years of monthly  data, compared to the period of record (1940-2020, the most recent year of data). The graphs below represent grades based on the frequency of very high and very low flow events, grouped in three-year intervals. For the 2018-2020 time period, the low flow events were a grade of A and the high flow events were a grade of D. Extremely high flow years (like 2015-2017) received a F grade for high flow, and a grade of A for low flow. The last major Texas drought (2010-2013), led to low-flow grades of D and B for 2009-2011 and 2012-2014, respectively.  The historic drought years of 1950-1957 received low-flow freshwater inflow grades D, F and F for 1949-1951, 1952-1954, and 1955-1957.

Fresh Water Inflows

Feed the Bay with necessary nutrients, sediments and freshwater

Freshwater Inflows

Click to learn more about Freshwater Inflows

What We Can do

Conserve Our Freshwater Inflows

C

Freshwater Inflows - High Inflows

A

Freshwater Inflows - Low Inflows

Sea Level

Relative sea level rise is the combination of subsidence and rising ocean levels. Rising sea levels affect vital coastal habitats, as well as human communities. Galveston Bay’s long history of sea level rise, subsidence, storm surge, and flooding, makes sea level an issue of critical concern.

The grade for sea level rise continues to be an F. On average, sea level has risen two feet over the last 100 years at Pier 21 in Galveston and the trend is expected to continue. Coastal cities around the U.S. such as Miami Beach, Florida; Wilmington, Delaware and Annapolis, Maryland are already dealing with chronic coastal flooding and finding ways to adapt to become more resilient.

Sea Level

The oldest Galveston Bay Report Card trend line going back more than 100 years

Sea Level

Click to learn more about Sea Level

What We Can do

Become More Resilient to Rising Sea Level

  • Contact your local officials and ask how your community is becoming more resilient and preparing for a changing coast.
  • Protect and restore habitat  like wetlands and seagrass.
  • Reduce your influence on the extent and rate at which coastal change takes place by reducing your carbon footprint.
F

Galveston Bay Sea Level

Water Temperature

Winter water temperatures represent the lower range of temperatures that plants and animals endure in order to live in the Bay. As changes in climate impact water temperatures, species of plants and animals move into new areas where they were not previously found. The Bay’s winter water temperatures for December to February have increased for the first time to be ten percent higher than the average values of the previous 15 years, resulting in the grade being lowered from an A to a B. This could have implications for native species, invasive species, bacteria and oxygen levels in the bay.

Winter Water Temperature

Click to learn more about Water Temperature

What We Can do

Help Native Species Thrive in Galveston Bay

  • Educate yourself about invasive species using the Galveston Bay Area field guides.
  • Learn about how changing temperatures affect coastal environments. Water temperature affects the amount of dissolved oxygen in the water and also tells us what types of plants and animals are able to live in the estuary.
  • Report aquatic invasive species to the Texas Parks and Wildlife Department in Dickinson: (281) 534-0100.
B

Galveston Bay Water Temperature

Water pH

Water acidity or alkalinity is measured by pH values. The lower the pH, the higher the acidity. Since Galveston Bay’s pH is determined by the mixing of saltwater from the Gulf of Mexico and freshwater from rivers and bayous in the watershed, changes in either source can have an impact. The pH values in the Bay are maintaining an appropriate range to support aquatic life, yielding the grade of an A

Galveston Bay Water PH

A crucial water quality indicator for Bay life

What We Can do

Reduce Your Carbon Footprint


A

Galveston Bay Water pH

Want more? Check the grades on other Indicators.

Overview
Water Quality
Pollution Events & Sources
Habitat
Wildlife
Human Health Risk
Coastal Change