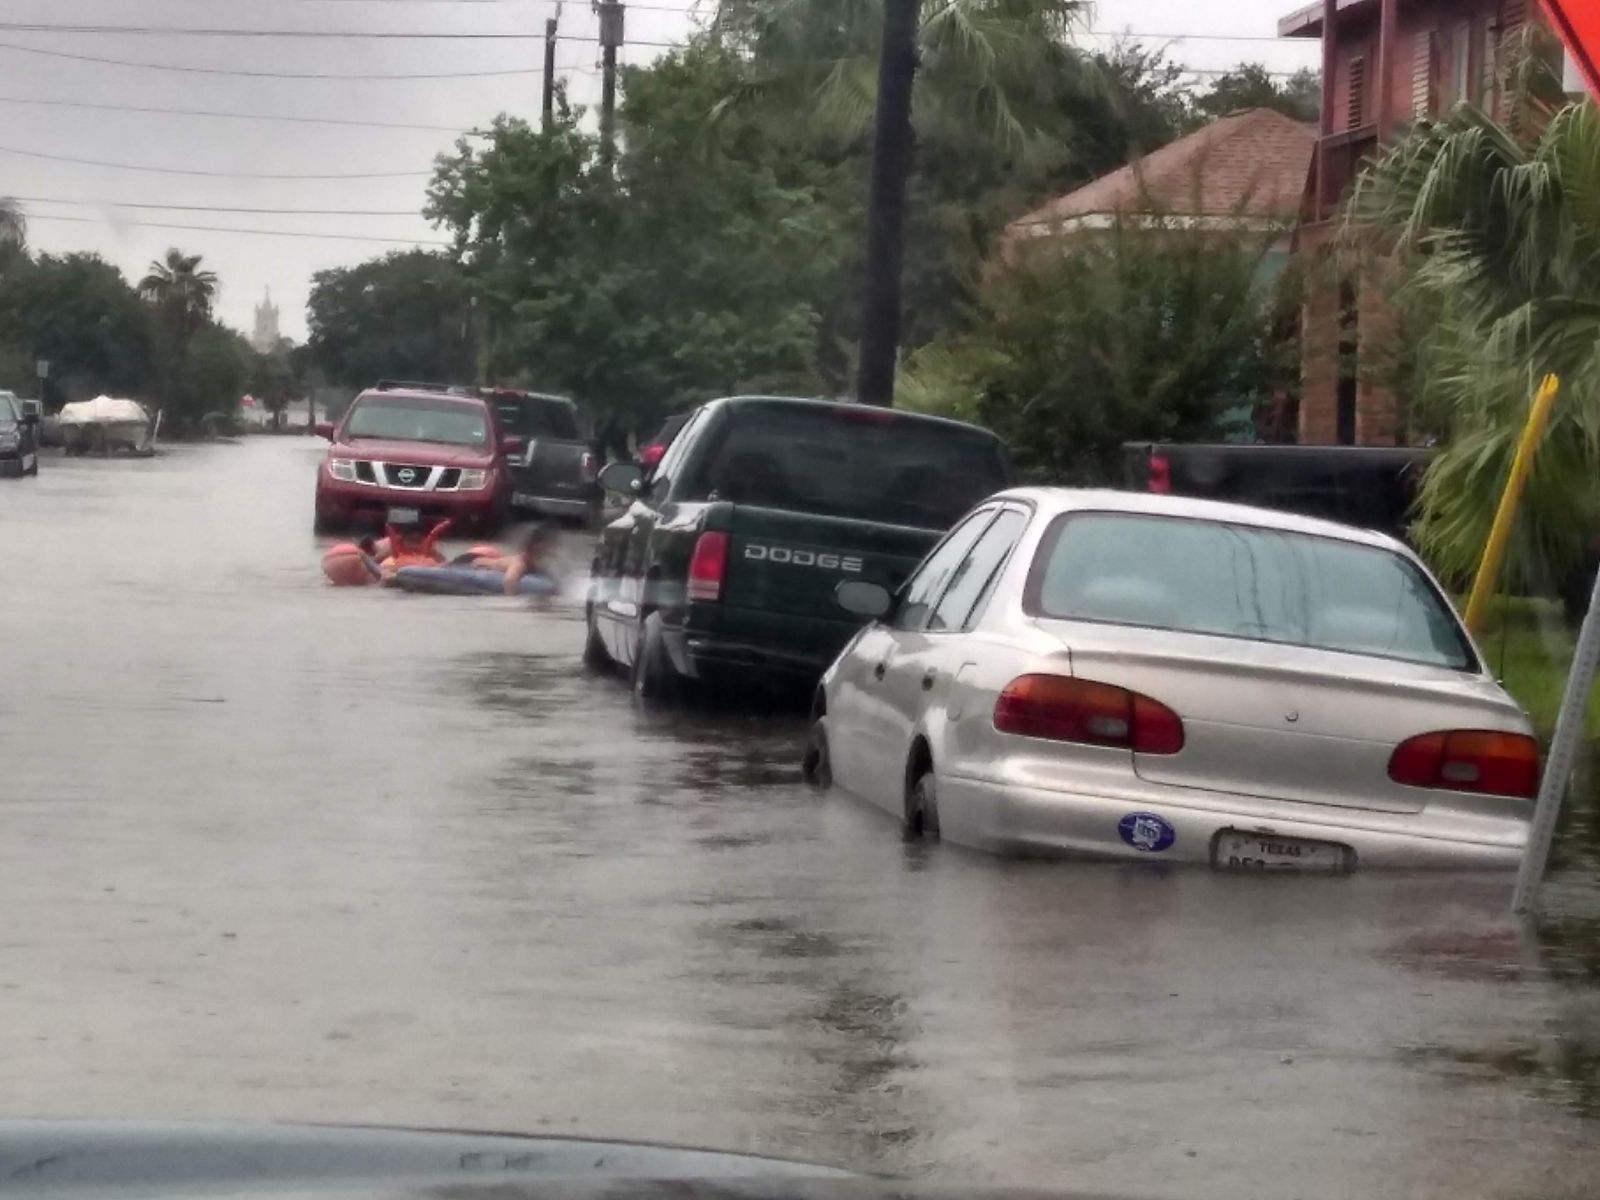
A flooded Galveston street, one block from Broadway.
If you feel like the Houston-Galveston region has had to deal with more coastal flooding in the last few years, you are not imagining it. Living in midtown Galveston, I can remember more than a few days this past fall that flooded my street, at times with over 15 inches of water. I stood out on my sidewalk, each time, with a measuring tape after moving my car to higher ground in the early hours of the morning. I have been lucky my house is still just high enough to stay dry. These stressful days are more frequent than they used to be and, at times, without warning or reason. Some of these flood events seem to occur without warning because of what is called high-tide flooding, “nuisance”, or “sunny day” flooding. This flooding can occur without heavy rains or storms.
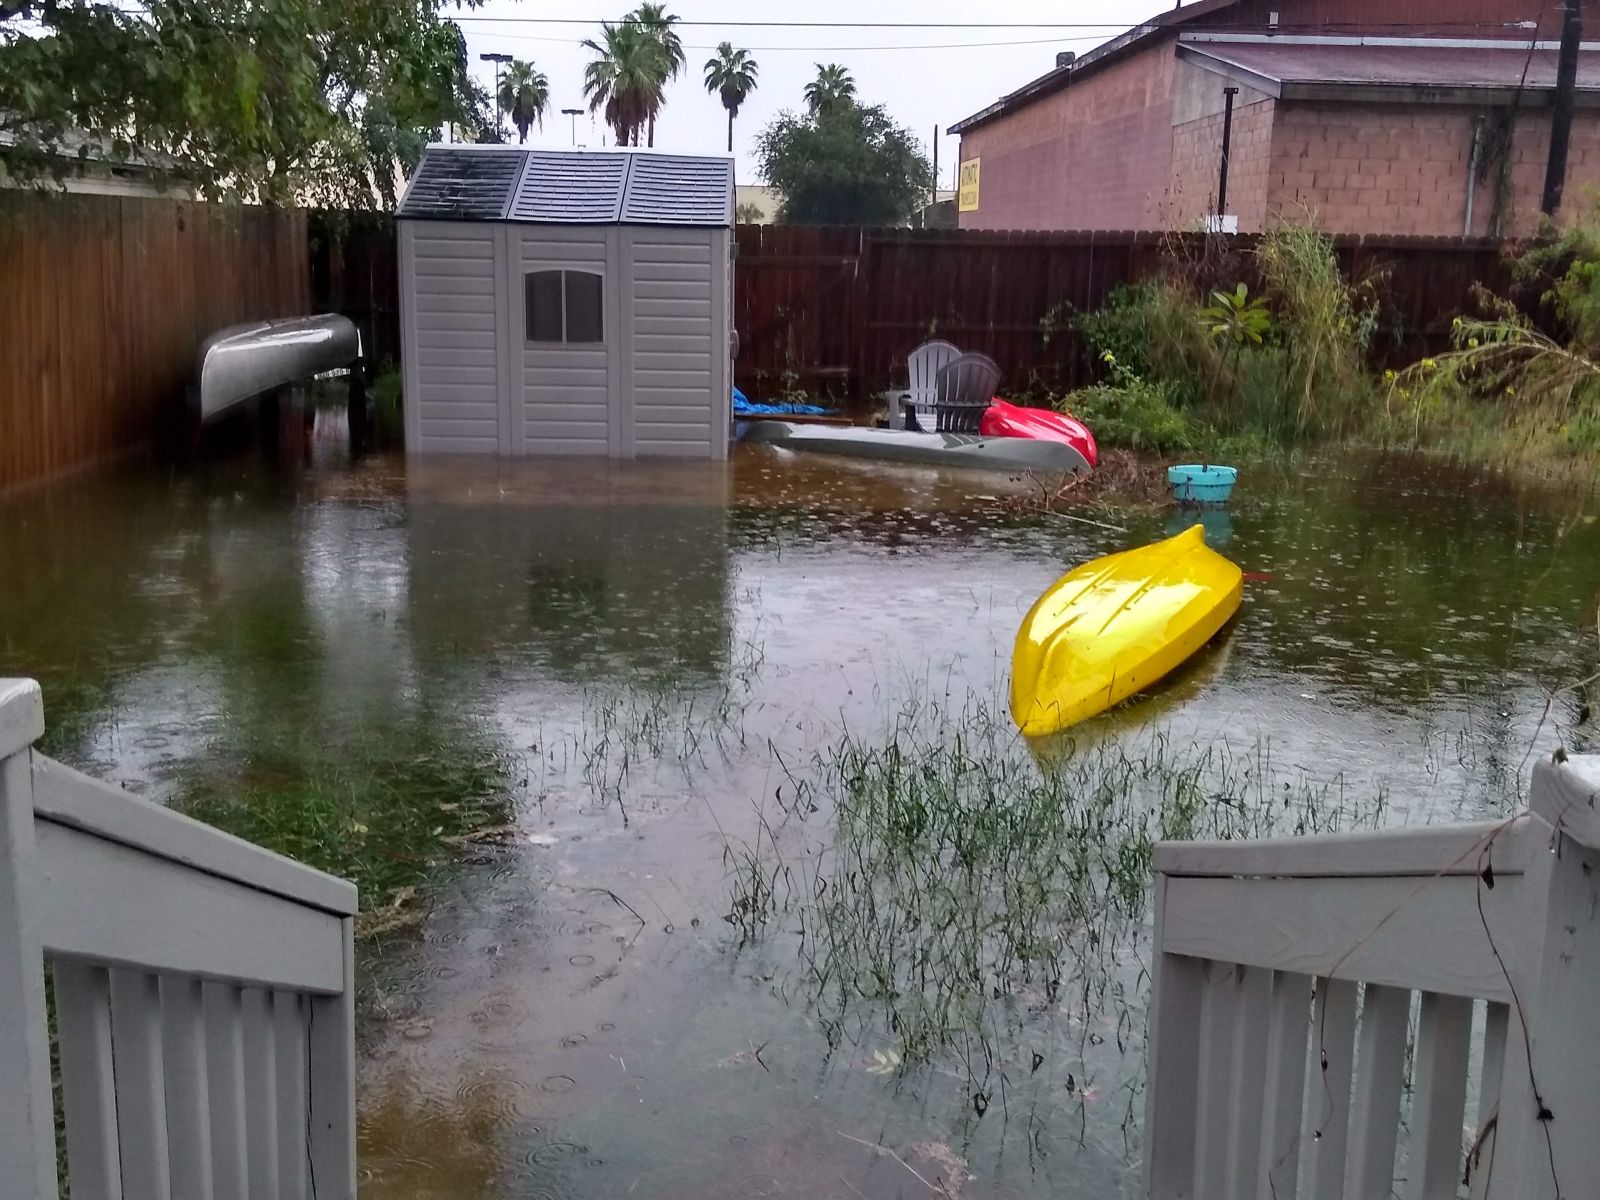
Sasha’s flooded backyard in midtown Galveston, one block south of Broadway.
High-tide flooding occurs when coastal water levels rise past a measured average height. Elevated tide levels can block or push water up outflow pipes of storm drains and prevent them from draining, leaving the water to gather in streets. Full-moon tides and shifts in currents can cause unusually high-water levels at times as well. As you can imagine, when you add rainfall to this issue it makes the flooding worse and all that water has nowhere to go. With global sea level rise gradually increasing the water level along our shores every year, and climate change causing more frequent rain events[1], high-tide flooding is happening more often. Last year, Eagle Point (near San Leon, Texas) set a new national record for number of high-tide flood days in one year at 64! The previous national record was 33 days. Morgan’s Point, also in Galveston Bay near LaPorte, Texas, had 22 high-tide flood days last year. To put it in perspective, the national average for 2019 was 4 high-tide flood days.
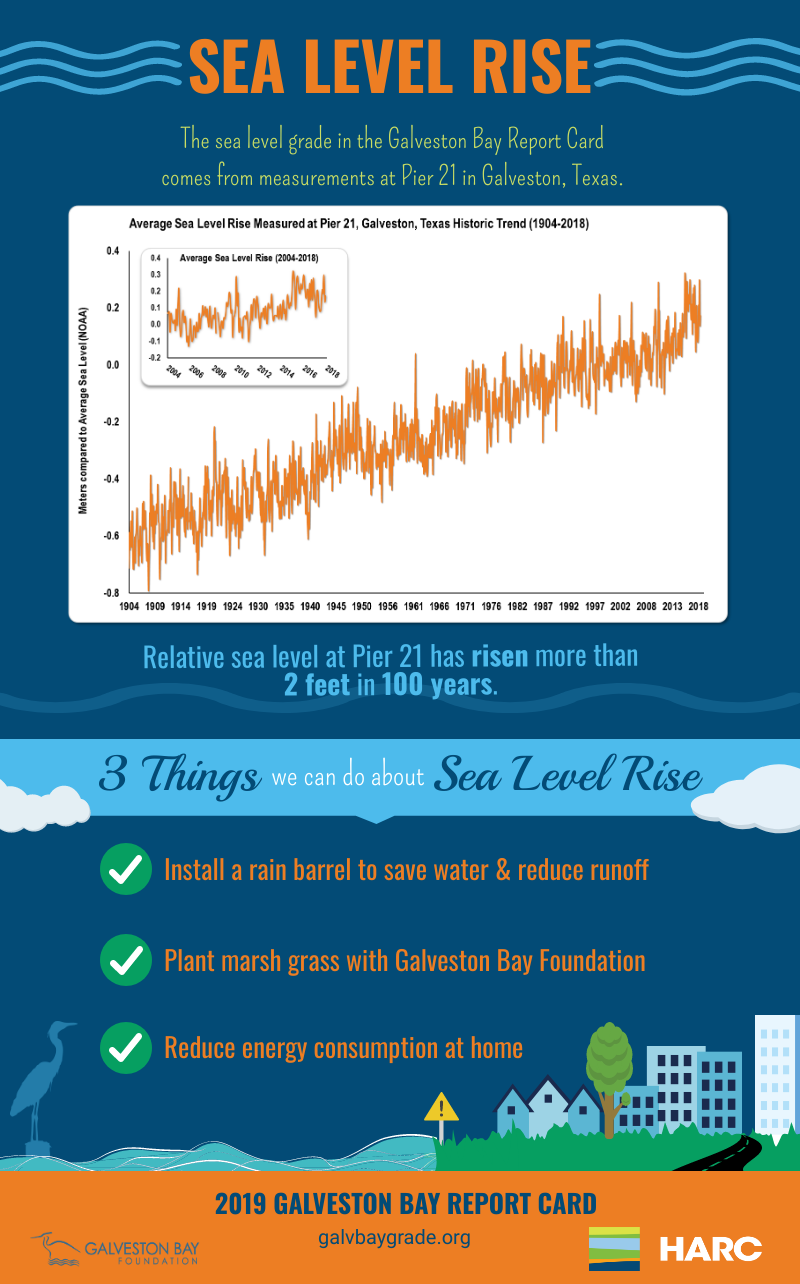
Another contributing factor making high-tide flooding more likely and more severe is subsidence. Subsidence is the settling or sinking of the ground’s surface, often caused by the soil compacting when groundwater is removed for use. Relative sea level rise is calculated by combining subsidence changes and global sea level rise and is continuing at a rate of about 2 feet every 100 years[2]. That may not sound like a lot, but I would rather not have an extra foot of water factoring into the flooding issues around my house over the time I own it. Considering my lawn already floods, that may be enough to flood my home. Subsidence also doesn’t just occur along major shorelines, so it can also make flooding along rivers and streams more likely during heavy rains due to lower elevation of nearby land. Erosion of land along the bay and its connected waterways also makes communities more susceptible to flooding.
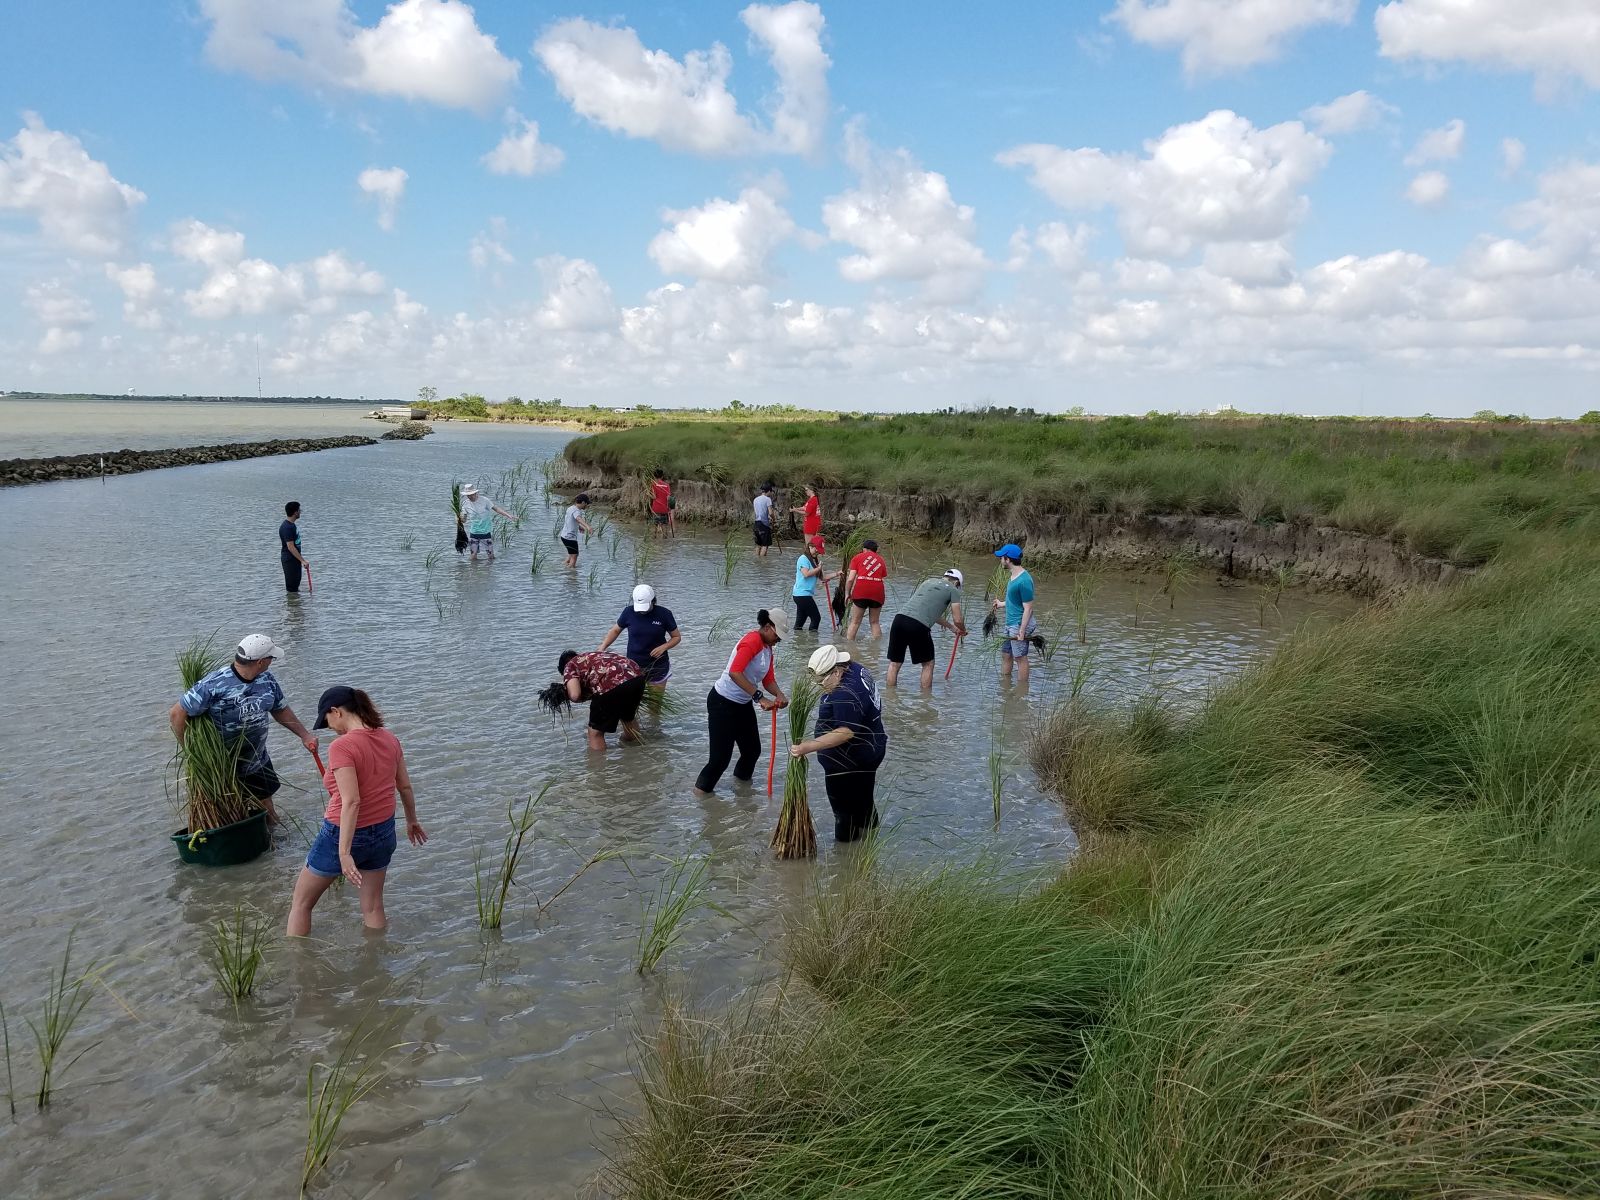
Marsh planting with GBF and University of Houston Students, April 2019.
The good news is there are things we can all do to help with subsidence and flooding issues and there are organizations and agencies working hard to monitor and mitigate impacts. Galveston Bay Foundation has programs in place to reduce erosion with marsh grass restoration and oyster reef building, protecting the stability of shorelines. They also have water conservation resources like rain barrel workshops and they support the Water My Yard tool to make it easier for people to reduce freshwater usage. By taking less from groundwater or our local rivers, we can slow subsidence and other issues. The Houston Advanced Research Center (HARC) staff assess relative sea level rise and other coastal change indicators each year and share the updates here through the Galveston Bay Report Card. The Harris-Galveston Subsidence District was created specifically to address subsidence and regulate groundwater removal. And the National Oceanic and Atmospheric Administration (NOAA) continues to track high tide flooding across the country. Understanding how and where this flooding is increasing in frequency can help us predict and mitigate future occurrences.
Check out the links to the different organizations and resources above and visit the What You Can Do tool on this site to find out how else you can help. Select the “Resilience to Coastal Change” filter for more suggestions on this topic.
See the original NOAA publication here.
[1] K. Emanuel. 2017. Assessing the present and future probability of Hurricane Harvey’s rainfall. Proceedings of the National Academy of Sciences Nov 2017, 114 (48) 12681-12684; DOI: 10.1073/pnas.1716222114
[2] NOAA. 2020. Tides & Currents Sea Level Trends.