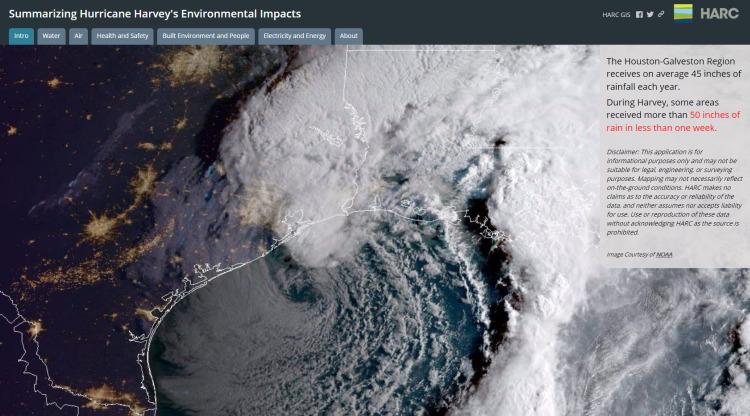
Hurricane Harvey made landfall August 25, 2017 near Port Aransas as a Category 4 hurricane. Between August 24 and August 31, some areas received more than 50 inches of rain. For reference, the Houston-Galveston Region receives on average 45 inches of rainfall each year.
The 2018 Report Card is a summary of indicator data representing the last year. The Report Card gives the public a way to look at long term change and acute stressors such as hurricanes and droughts. The Report Card is not necessarily representative of the conditions during Hurricane Harvey because of monitoring data gaps in the days and weeks after the storm, but rather it provides context for these large events. Some data sets, like sea level, were not disrupted by Harvey. Several data sets, such as birds, winter water temperature, and freshwater inflows, were collected before Harvey’s impacts. Other data sets, like water quality, bacteria, and fish were collected both before and after Hurricane Harvey. In the days following events like Harvey, it is often difficult and sometimes unsafe for agencies to resume sampling schedules, and so we expect there to be gaps in the datasets. In most cases, the gaps were short and likely still include some impacts of Hurricane Harvey.
The purpose of the Galveston Bay Report Card is to present an annual snapshot of Galveston Bay across 22 indicators and to record how they have changed over time. For all indicators, we will continue to look for lasting impacts from Harvey in addition to other factors that influence the health of Galveston Bay. For a closer look at conditions immediately following Hurricane Harvey, visit HARC’s Harvey Impacts story map.